

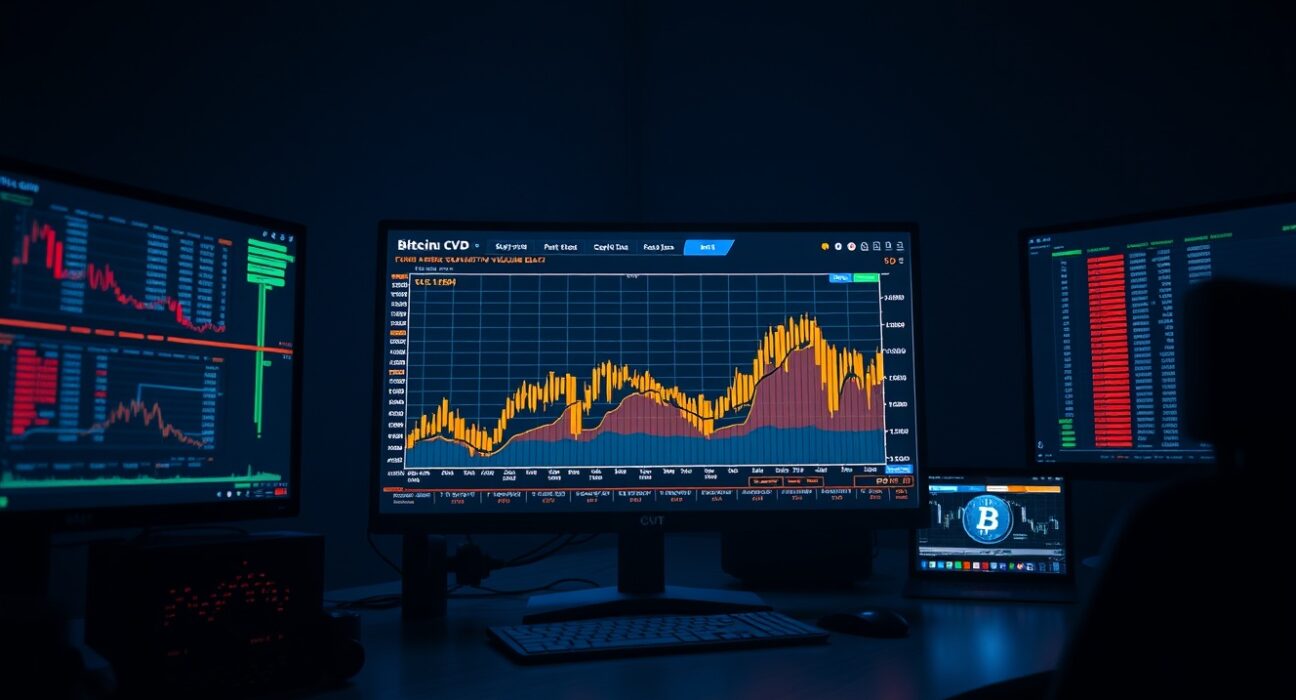
As of 12:00 a.m. UTC, the BTC/USDT spot pair is exhibiting notable order book activity, as revealed by the Cumulative Volume Delta (CVD) chart. This technical tool, often used by institutional and retail traders alike, provides a granular view of buying and selling pressure at specific price levels. The latest data offers insight into potential support and resistance zones that may influence Bitcoin’s short-term price action.
Understanding the Volume Heatmap
The top section of the chart displays a Volume Heatmap, which tracks the volume of trades executed at various price levels. The background color intensifies when the price lingers in a certain range or experiences significant movement. These brighter areas often indicate where large numbers of orders have been filled, creating potential support or resistance levels. Traders watch these zones closely, as they can act as psychological barriers where price may reverse or consolidate.
Cumulative Volume Delta (CVD) Breakdown
The bottom section of the chart presents the Cumulative Volume Delta (CVD), which categorizes buy and sell orders by trade size. As buy orders increase, the corresponding colored line rises. The yellow line tracks orders between $100 and $1,000, representing retail-sized trades. The brown line, in contrast, tracks large orders between $1 million and $10 million, often associated with institutional activity. The divergence or convergence of these lines can signal shifts in market sentiment.
What the Midnight UTC Data Suggests
At the time of analysis, the brown line (large orders) showed a steady upward trajectory, indicating sustained institutional buying interest. Meanwhile, the yellow line (retail orders) remained relatively flat. This pattern often suggests that larger market participants are accumulating positions while smaller traders are more cautious. Such dynamics can precede significant price moves, especially if the buying pressure from large orders continues to build.
Why This Matters for Traders
Understanding CVD and volume heatmap data helps traders identify where liquidity is concentrated. These levels can act as magnets for price or as barriers that prevent further movement. For Bitcoin, which remains highly sensitive to order book imbalances, this analysis provides actionable context for setting entry and exit points. It also helps differentiate between noise and genuine market shifts, a critical skill in volatile conditions.
Conclusion
The BTC/USDT spot CVD chart as of 12:00 a.m. UTC reveals a market where institutional accumulation appears to be the dominant force, while retail activity remains subdued. The volume heatmap highlights key price levels that may serve as support or resistance in the coming sessions. As always, traders should combine this data with broader market context and risk management strategies.
FAQs
Q1: What does Cumulative Volume Delta (CVD) measure?
CVD measures the difference between buying and selling volume, categorized by trade size. It helps traders identify whether large or small orders are driving price movement.
Q2: How is the Volume Heatmap useful for trading?
The Volume Heatmap shows where trading activity is concentrated. Brighter areas indicate higher volume, which often act as support or resistance levels because many orders were filled there.
Q3: Why does the midnight UTC time stamp matter?
Midnight UTC is a common reference point for daily market analysis, as it aligns with the start of the trading day in many global markets. It provides a consistent snapshot for comparing intraday trends.
Disclaimer: The information provided is not trading advice, Bitcoinworld.co.in holds no liability for any investments made based on the information provided on this page. We strongly recommend independent research and/or consultation with a qualified professional before making any investment decisions.
