
On July 1, at 11 a.m. UTC, the BTC/USDT spot market is presenting a detailed picture of order flow dynamics through the Cumulative Volume Delta (CVD) indicator. This tool, which analyzes the order book, helps traders understand the balance between buying and selling pressure at various price levels.
Understanding the Volume Heatmap
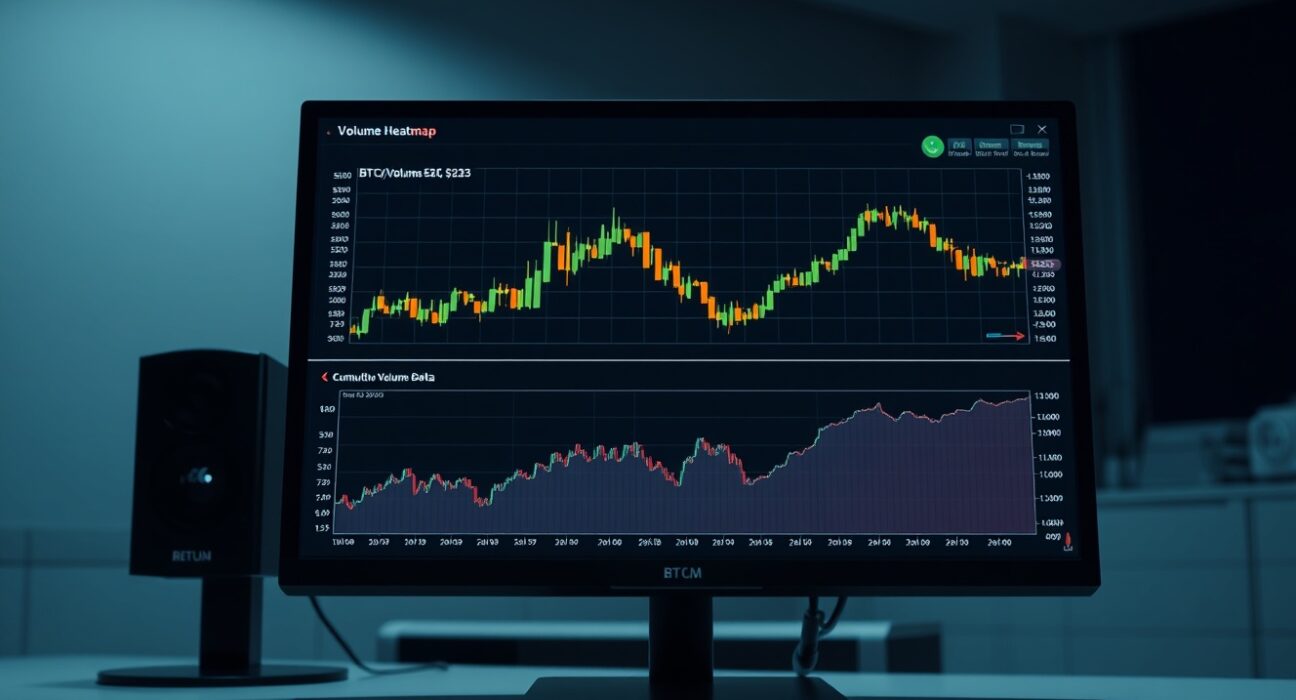
The top section of the chart features a Volume Heatmap, which tracks trading activity at specific price points. When the price lingers in a particular range for an extended period or moves significantly through it, the background color brightens. These brighter zones can act as potential support or resistance levels, offering clues about where the market might react.
Interpreting the CVD Indicator
The CVD indicator, shown in the lower section, breaks down buy and sell orders by trade size. Each colored line represents a different order size category. A rising line indicates an increase in buy orders within that category. For instance, the yellow line tracks orders between $100 and $1,000, while the brown line represents large-scale institutional orders ranging from $1 million to $10 million. By observing which size categories are driving the market, traders can gauge the strength of the current trend.
What This Means for Traders
This data is valuable for short-term traders and market analysts. A rising CVD, especially in the larger trade-size categories, suggests strong buying interest from institutional players. Conversely, a declining CVD may indicate selling pressure. The Volume Heatmap adds another layer by highlighting price levels where significant volume has already been traded, making them key areas to watch for potential reversals or breakouts.
Conclusion
The July 1 BTC/USDT CVD chart provides a granular view of market microstructure. By combining the Volume Heatmap with the CVD indicator, traders can better assess the conviction behind price movements and identify key support and resistance zones.
FAQs
Q1: What does a rising CVD line indicate?
A rising line in the Cumulative Volume Delta (CVD) indicates an increase in buy orders within that specific trade-size category, signaling bullish pressure.
Q2: How can the Volume Heatmap be used in trading?
The Volume Heatmap highlights price levels where significant trading activity has occurred. These areas often act as support or resistance, as traders remember the volume traded there.
Q3: Why are large trade-size categories important?
Large trade-size categories, such as the brown line representing $1 million to $10 million orders, often reflect institutional activity. Movements in these categories can signal the direction of smart money.
Disclaimer: The information provided is not trading advice, Bitcoinworld.co.in holds no liability for any investments made based on the information provided on this page. We strongly recommend independent research and/or consultation with a qualified professional before making any investment decisions.