
Exciting times for Ethereum enthusiasts! After a period of anticipation, Ethereum (ETH) has finally broken free from the shackles of the $3,000 resistance level. This bullish move signals renewed momentum in the market and has traders and investors alike wondering: what’s next for the world’s second-largest cryptocurrency? Let’s dive into the recent price action and analyze what could be on the horizon for ETH.
Ethereum Breaks Key Resistance – What Does It Mean?
For weeks, the $3,000 mark acted as a significant ceiling for Ethereum’s price. However, recent trading sessions have shown a decisive shift. ETH not only pierced through this barrier but also confidently surpassed the $3,050 level and the 100 hourly simple moving average. This breakout is a strong indicator of bullish sentiment and suggests buyers are gaining control.
Looking at the hourly chart of ETH/USD, the upward trajectory is evident. The price action decisively broke through previous short-term downtrend lines at $3,000 and $3,080, paving the way for a surge to a new yearly high of $3,190. This peak was achieved after successfully overcoming the $3,120 resistance, showcasing the strength of the current bullish trend.
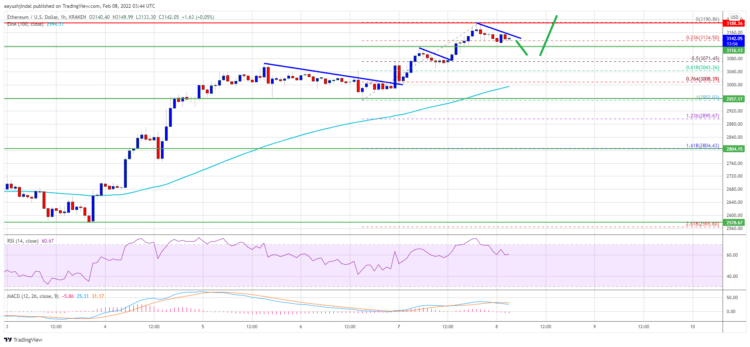
Source : ETHUSD on Tradingview
Analyzing Key Resistance and Support Levels for ETH
Currently, Ethereum is taking a breather, consolidating its gains below the $3,190 peak. This consolidation phase is natural after a significant price jump and can provide a base for further upward movement. A minor dip was observed, with the price briefly falling below the 23.6% Fibonacci retracement level. This retracement level is measured from the recent swing low of $2,950 to the high of $3,190, indicating a healthy correction within the uptrend.
What are the immediate resistance levels to watch?
- $3,160: This level represents immediate resistance and coincides with a connecting bearish trend line visible on the ETH/USD hourly chart. A successful break above this point could signal the continuation of the bullish momentum.
- $3,200: This is the next major hurdle. Overcoming this psychological and technical resistance level is crucial for ETH to aim for higher targets.
- $3,350 – $3,380: Beyond $3,200, these levels become the subsequent targets in the short term. A strong bullish push could propel ETH towards these higher price points.
What are the critical support levels to monitor?
- $3,115: This level acts as the immediate support in case of a downward correction. Holding above this level is important to maintain the bullish structure.
- $3,080: A more significant support level, coinciding with the 50% Fibonacci retracement of the recent upward swing. This level is crucial as a breach below it could indicate a deeper correction.
- $3,000: This psychological level and the 100 hourly Simple Moving Average (SMA) represent a strong support zone. Falling below this level could trigger a more substantial downside correction and potentially negate the recent bullish breakout.
Fibonacci Retracement: A Quick Explanation
You might be wondering about Fibonacci retracement levels. In technical analysis, Fibonacci retracement is a popular tool used to identify potential support and resistance levels. It’s based on the Fibonacci sequence and ratios found in nature and financial markets. Traders use these levels to:
- Identify potential areas of support during a downtrend: Prices often retrace to Fibonacci levels before resuming their upward movement.
- Identify potential areas of resistance during an uptrend: Prices might encounter resistance at Fibonacci levels before continuing downwards.
- Determine potential entry and exit points for trades: Traders may look to buy near Fibonacci support levels and sell near resistance levels.
In our ETH analysis, the 23.6% and 50% Fibonacci retracement levels are helping us pinpoint potential short-term support areas.
What’s Next for Ethereum? Bullish or Bearish Scenario?
The current market sentiment surrounding Ethereum appears to be cautiously optimistic. The break above $3,000 is a positive sign, but sustained momentum is key. Let’s consider both potential scenarios:
| Scenario | Triggers | Potential Outcome |
|---|---|---|
| Bullish Scenario |
|
ETH price could rally towards $3,350 – $3,380 and potentially higher, establishing a new higher trading range. |
| Bearish Scenario |
|
ETH price could experience a negative correction, potentially testing lower support levels around $3,000 or even $2,950, before a potential rebound. |
Stay Informed and Trade Responsibly
Ethereum’s price action is dynamic and influenced by a multitude of factors. Staying informed about market trends, technical indicators, and fundamental developments is crucial for making informed trading and investment decisions.
Key Takeaways:
- Ethereum has broken above the crucial $3,000 resistance level, signaling bullish momentum.
- Key resistance levels to watch are $3,160, $3,200, and then $3,350-$3,380.
- Important support levels are at $3,115, $3,080, and $3,000.
- A break below $3,000 could lead to a deeper correction.
- Monitor market sentiment and news flow for further price direction.
As always, remember that cryptocurrency trading involves risk. Conduct thorough research and consider your risk tolerance before making any investment decisions. Keep an eye on Ethereum’s price movements and be prepared for potential volatility in the crypto market.
Related Posts – Ferrari joins the NFT universe through a collaboration with a Swiss…
Disclaimer: The information provided is not trading advice, Bitcoinworld.co.in holds no liability for any investments made based on the information provided on this page. We strongly recommend independent research and/or consultation with a qualified professional before making any investment decisions.