

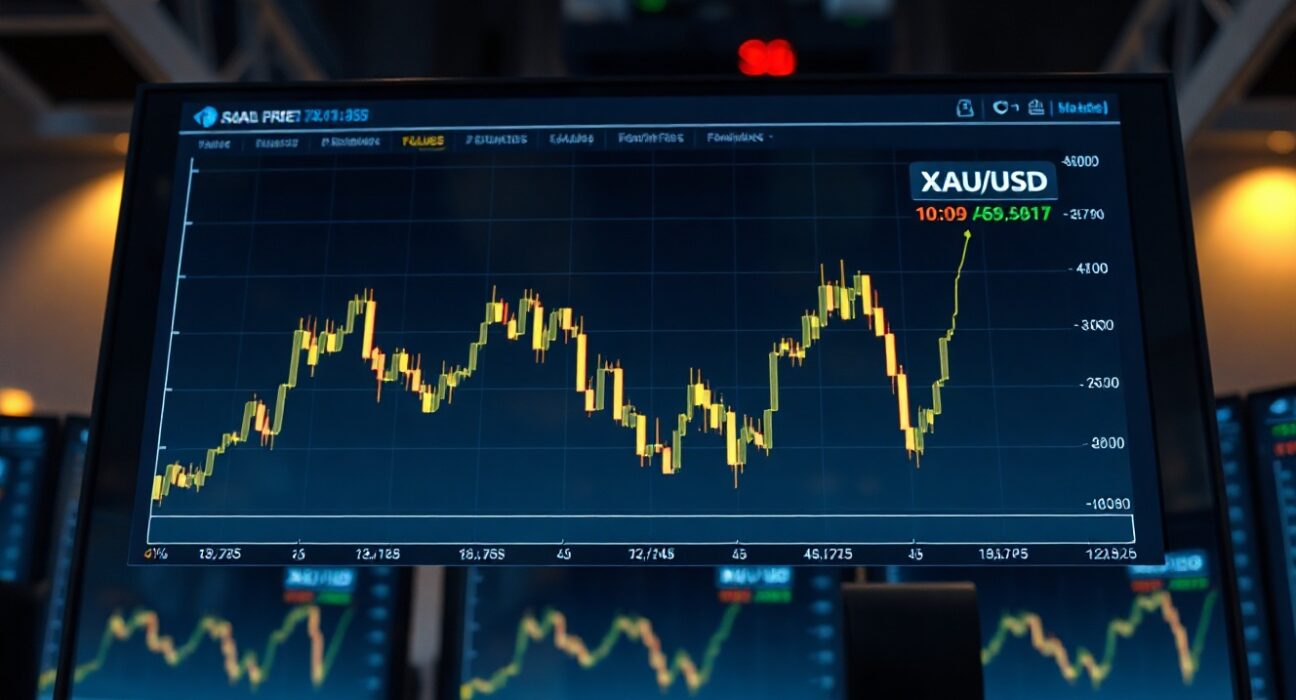
Gold prices are currently clinging to the 100-day Simple Moving Average (SMA) on the daily chart, a key technical level that is keeping the immediate outlook balanced while upside risks remain intact for the XAU/USD pair. This positioning suggests that while momentum has stalled, the broader technical structure has not yet turned bearish, leaving the door open for a potential push toward recent highs.
Why the 100-Day SMA is a Critical Support Level
The 100-day SMA is a widely monitored indicator by institutional traders and algorithmic systems, acting as a dynamic support or resistance level. For gold, holding above this line is often interpreted as a sign that the medium-term uptrend is still valid, attracting buyers on dips. The current consolidation directly on this level indicates a market in equilibrium, where sellers are testing the resolve of longer-term bulls.
This technical standoff comes after a period of volatility driven by shifting expectations for global monetary policy. The market’s focus remains on the Federal Reserve’s next moves, as the opportunity cost of holding non-yielding assets like gold is directly tied to interest rate levels. Any signal from the Fed suggesting a pause in rate hikes or potential cuts would likely provide the fundamental catalyst needed for gold to break out of this range.
Market Drivers and the Path Forward for XAU/USD
Beyond the immediate technical picture, several macroeconomic factors are contributing to the underlying support for gold. Persistent geopolitical tensions and central bank buying, particularly from emerging market economies, continue to provide a structural floor under prices. These long-term demand drivers contrast with the short-term pressure from a relatively strong US Dollar and elevated bond yields.
For traders, the key is watching how price reacts to this pivotal support level. A decisive daily close above the 100-day SMA could signal a resumption of the uptrend, targeting the next resistance zones. Conversely, a sustained break below it might expose the metal to further downside, potentially toward the 200-day SMA. However, the current ‘upside risks intact’ scenario suggests that the market is more inclined to interpret any dip as a buying opportunity rather than the start of a new downtrend.
Interpreting the Technical Setup for Investors
For investors, the importance of the 100-day SMA lies in its role as a risk management benchmark. It provides a clear, objective level to gauge the health of a long-term position. The fact that gold is holding this line, despite recent headwinds, suggests that the corrective phase may be maturing. A bounce from this level would not only be a positive technical signal but also a confirmation that the fundamental drivers of the gold market remain robust.
Conclusion
Gold’s ability to hold the 100-day SMA is a positive sign for bulls, indicating that the recent pullback is being absorbed by buyers. While the market remains in a wait-and-see mode, the balance of risks appears tilted to the upside. The next significant move will likely be dictated by incoming economic data and its impact on Federal Reserve policy expectations, making the current technical support level a crucial line in the sand for the XAU/USD pair.
FAQs
Q1: What does the 100-day SMA indicate for gold prices?
The 100-day SMA is a trend indicator. When the gold price is above it, it suggests the medium-term trend is bullish. Holding this level is seen as a sign of strength and can act as a support zone where buyers may step in.
Q2: Why are upside risks considered ‘intact’ for gold?
Upside risks remain because the fundamental drivers, such as central bank buying and geopolitical uncertainty, are still supportive. Additionally, the market’s expectation that major central banks, especially the Fed, may eventually cut interest rates provides a potential catalyst for higher prices.
Q3: What could invalidate the current bullish outlook for XAU/USD?
A sustained and decisive break below the 100-day SMA on a closing basis would be the primary technical signal that the bullish outlook is weakening. This could lead to further selling pressure and a test of lower support levels, potentially the 200-day SMA.
Disclaimer: The information provided is not trading advice, Bitcoinworld.co.in holds no liability for any investments made based on the information provided on this page. We strongly recommend independent research and/or consultation with a qualified professional before making any investment decisions.
