
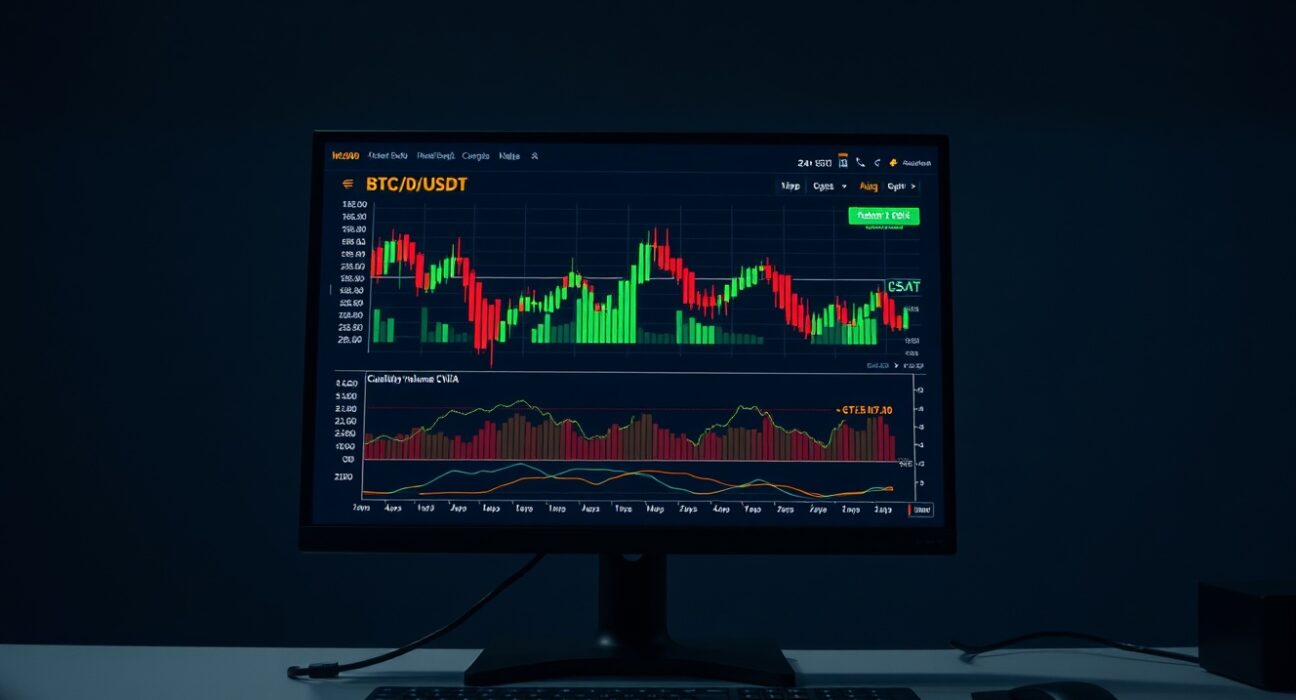
The Spot Cumulative Volume Delta (CVD) chart for the BTC/USDT spot pair provides traders with a granular view of order book dynamics, tracking both the intensity of trading activity at specific price levels and the balance between buying and selling pressure. The latest data, captured on June 6 at 12:00 a.m. UTC, offers a snapshot of market microstructure that can inform short-term trading decisions.
Understanding the Volume Heatmap
The upper section of the chart displays a Volume Heatmap, which visualizes the concentration of trades executed at various price points. When the price remains within a narrow range for an extended period, or when it moves through a level with significant trading volume, the background color on the heatmap brightens. These brighter zones often act as technical support or resistance levels, as they represent areas where a large number of orders were previously filled. Traders monitor these zones for potential price reactions, such as bounces or breakdowns.
Interpreting the Cumulative Volume Delta (CVD)
The lower section of the chart shows the Cumulative Volume Delta (CVD), which categorizes buy and sell orders by trade size. As buy orders accumulate, the corresponding colored line rises; as sell orders dominate, the line declines. The chart tracks multiple order size categories, each represented by a different color. For instance, the yellow line tracks orders between $100 and $1,000, while the brown line tracks large institutional-sized orders between $1 million and $10 million. Divergences between the CVD lines and price action can signal shifts in market sentiment. For example, if price is rising but the CVD line for large orders is falling, it may indicate that large traders are distributing their positions, potentially foreshadowing a reversal.
Why This Data Matters for Traders
This type of order book analysis goes beyond simple price and volume charts. It provides a real-time view of the supply and demand imbalance at the order level, offering earlier signals of potential breakouts or breakdowns. For active traders, especially those using scalping or intraday strategies, the Spot CVD chart helps identify where liquidity is concentrated and whether large players are accumulating or distributing. The June 6 data point, taken at a low-activity hour (midnight UTC), may also reveal baseline order book structure without the noise of peak trading hours.
Conclusion
The Spot CVD chart for BTC/USDT remains a valuable tool for traders seeking to understand market depth and order flow. By combining the Volume Heatmap with the Cumulative Volume Delta, traders can identify key price levels where significant trading activity has occurred and gauge the relative strength of buyers versus sellers across different trade sizes. The June 6 snapshot provides a reference point for monitoring how these dynamics evolve over the trading session.
FAQs
Q1: What is the difference between the Volume Heatmap and the Cumulative Volume Delta?
The Volume Heatmap shows the total volume of trades at each price level, highlighting areas of high activity that may act as support or resistance. The Cumulative Volume Delta (CVD) tracks the net difference between buying and selling volume, broken down by trade size, showing the direction and strength of order flow.
Q2: How can traders use the CVD lines for different trade sizes?
By comparing CVD lines for different order sizes (e.g., small retail orders vs. large institutional orders), traders can detect whether large players are accumulating or distributing. If small orders are buying but large orders are selling, it may signal a potential top.
Q3: Is the Spot CVD chart only useful for short-term trading?
While it is most commonly used by short-term traders (scalpers and day traders), the insights from the CVD chart can also inform swing traders and position traders by identifying key liquidity zones and shifts in market structure that may have longer-term implications.
Disclaimer: The information provided is not trading advice, Bitcoinworld.co.in holds no liability for any investments made based on the information provided on this page. We strongly recommend independent research and/or consultation with a qualified professional before making any investment decisions.