
2026-06-26
Gold prices in Saudi Arabia experienced a decline today, according to data tracked by Bitcoin World. The movement reflects broader shifts in the.

Gold prices in Saudi Arabia experienced a decline today, according to data tracked by Bitcoin World. The movement reflects broader shifts in the.

The price of gold in the Philippines experienced a decline today, according to data tracked by Bitcoin World. This movement reflects ongoing shifts.

The United States Energy Information Administration (EIA) reported a natural gas storage change of 76 billion cubic feet (Bcf) for the week ending.

Silver prices recorded a modest increase during today’s trading session, according to data tracked by Bitcoin World. The move comes as investors weigh.
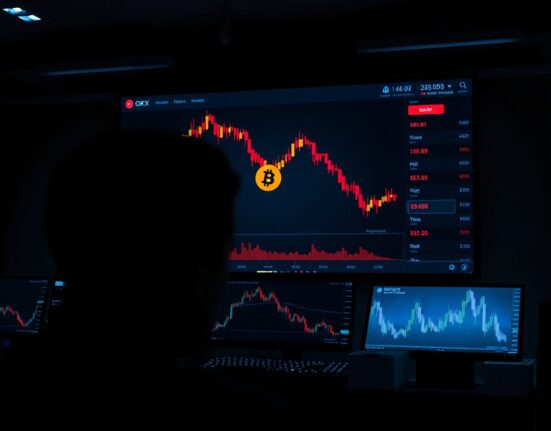
OKX has recorded a 10.51% decrease in its Bitcoin holdings over the past seven days, marking the largest decline among major cryptocurrency exchanges,.

Gold prices in India declined today, according to data tracked by Bitcoin World. The dip follows recent global market trends and shifts in.

Silver prices moved higher in today’s trading session, according to data tracked by Bitcoin World. The precious metal extended its recent upward trend,.

The Spot Cumulative Volume Delta (CVD) chart for the BTC/USDT trading pair provides traders with a detailed view of order book dynamics and.
Silver prices recorded a modest increase today, according to data tracked by Bitcoin World. The latest figures show the precious metal moving higher.
Silver prices edged higher in today’s trading session, according to data tracked by Bitcoin World. The move aligns with broader strength in the.