
2026-07-10
The British pound has entered a consolidation phase against the Japanese yen after touching a fresh all-time high near the 218.00 level during.

The British pound has entered a consolidation phase against the Japanese yen after touching a fresh all-time high near the 218.00 level during.

The GBP/JPY currency pair continues to demonstrate a clear bullish bias, with price action respecting a well-defined higher-high structure. Traders and analysts are.
Silver prices have staged a notable recovery in recent trading sessions, climbing back toward the psychologically significant $60 per ounce mark. However, beneath.

West Texas Intermediate (WTI) crude oil futures faced a decisive technical rejection at the 200-day Simple Moving Average (SMA) this week, reinforcing the.

Visa Inc. (NYSE: V) shares have broken above a key resistance level, signaling a potential end to a corrective phase that technical analysts.
The silver market continues to face downward pressure as XAG/USD remains locked within a defined bearish channel on the daily chart. This technical.
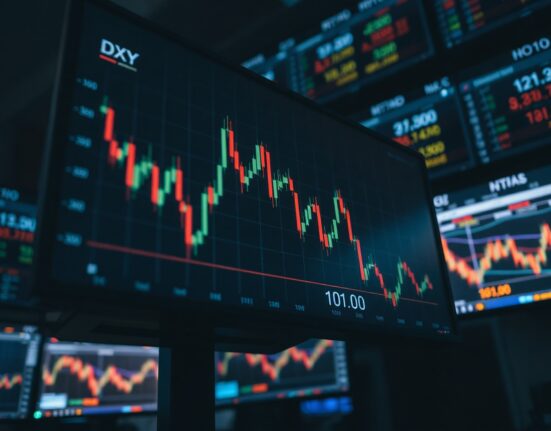
The US Dollar Index (DXY) is trading in a precarious position, hovering near the 23.6% Fibonacci retracement level and flirting with a fresh.
The USD/CAD currency pair is maintaining a position above the 1.4150 level during Tuesday’s trading session, extending its recent bullish run. The pair’s.
The FTSE 100 has decisively broken below a critical support level, a move that market analysts are watching closely as a potential precursor.

The EUR/GBP currency pair continues to trade below the 0.8550 resistance level, with recent attempts at a bullish breakout failing to gain traction..