Navigating the volatile world of cryptocurrency trading requires more than just gut feeling. Smart traders look for signals, and one fascinating indicator lies within the futures market – specifically, Bitcoin futures liquidations. Ever wondered what those sudden price swings mean for your trades and the broader market sentiment? Let’s dive into recent data to understand what’s happening beneath the surface of the crypto market.
Understanding Futures Liquidations: A Trader’s Reality Check
Before we get into the numbers, let’s quickly recap what futures liquidations are. In the crypto futures market, traders use leverage to amplify their potential gains (and losses!). When a trader’s position moves against them and hits a predetermined threshold (liquidation price), the exchange automatically closes the position to prevent further losses. This is called liquidation.
Now, consider this: liquidations can happen on both sides of a trade – when prices go up (short positions get liquidated) and when prices go down (long positions get liquidated). The balance between these liquidations can tell us a lot about market sentiment and potential price movements.
Long Liquidation Dominance: Who’s Getting Squeezed?
The metric we’re focusing on is “futures long liquidations dominance.” This simply measures the percentage of total liquidations that happened to traders who were betting on the price going up (long positions). A high percentage of long liquidations suggests that a significant number of traders were caught off guard by a price drop.
Let’s look at some real-world examples from February 2022, based on data from Glassnode:
- February 4th: Short Squeeze Mania (Long Liquidations at just 11%)
Imagine this: Bitcoin’s price suddenly jumps from $37,000 to $41,000 in a single day. What happens? Traders who were betting on the price going down (short positions) are suddenly in trouble! On February 4th, only 11% of liquidations were on the long side. A whopping 89% were short liquidations! This points to a classic “short squeeze.” Many traders were positioned to profit from a price decrease, but the unexpected surge forced them to close their positions, further driving the price up. These extreme imbalances in liquidation dominance are often seen after sharp, unexpected price moves.
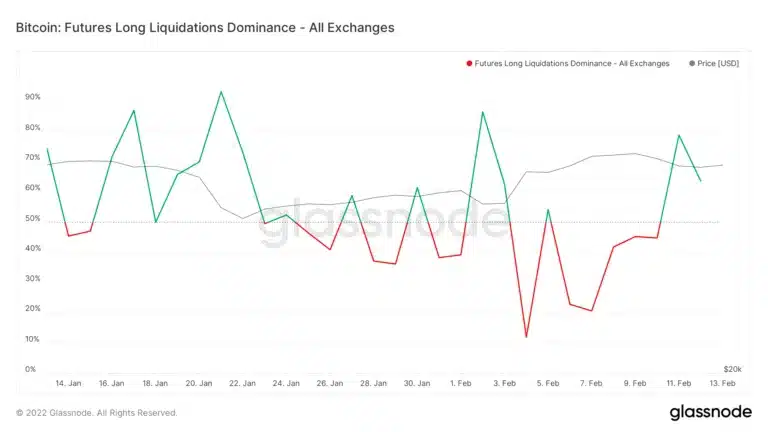
Source: Glassnode
- February 13th: A More Balanced Market (Long Liquidations at 61%)
Fast forward to February 13th, and the picture changes. Long liquidations dominance stood at 61%. This is a much more balanced figure. It suggests that both long and short positions were being liquidated, indicating a market experiencing more typical volatility without a strong directional bias in liquidations.
Futures Volume: The Engine of Price Action
Now, let’s bring another crucial piece of the puzzle into the mix: futures volume. While liquidation data tells us about trader positioning and reactions, futures volume reflects the overall trading activity and the strength of price movements.
The article mentions that futures volume was low in February compared to the previous month. Why is this important? Low volume generally means that even if liquidations occur, they are less likely to trigger massive price swings. Think of it like this: a small wave in a large ocean might not cause much disturbance, but a similar wave in a small pond can be much more impactful.
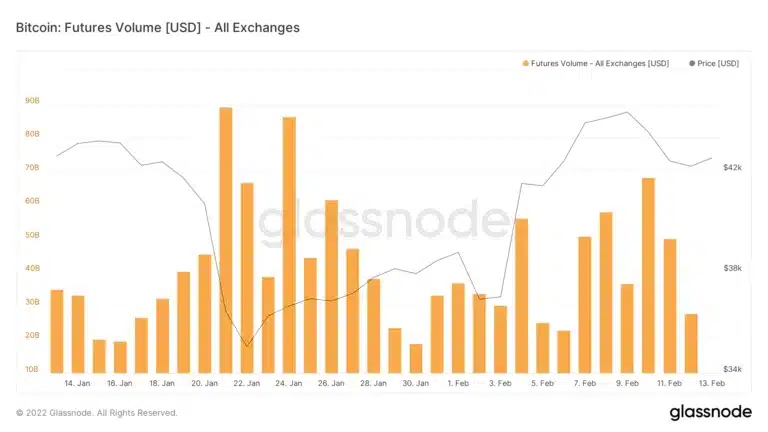
Source: Glassnode
Options Market Sentiment: Confirming the Outlook?
To get a more complete picture, it’s always wise to look at multiple indicators. The article introduces the put/call ratio from the options market. Think of the put/call ratio as a sentiment gauge for options traders. A put option is a bet that the price will go down, while a call option is a bet that the price will go up.
A put/call ratio of 0.77, as mentioned in the article, means that there are fewer put options being bought compared to call options. Generally, a ratio below 1 suggests bullish sentiment, as traders are more inclined to bet on price increases (buying calls) than price decreases (buying puts). This aligns with the balanced long liquidation dominance on February 13th – neither indicator points towards strong bearishness.
Putting It All Together: What Does This Mean for Crypto Traders?
So, what can we conclude from this data snapshot in February 2022?
- No Extreme Bearishness: The balanced long liquidation dominance on February 13th and the bullish put/call ratio of 0.77 don’t indicate widespread fear or strong bearish sentiment in the market at that time.
- Lower Volatility Potential (Due to Volume): The lower futures volume suggests that even with liquidations, dramatic price swings might be less likely compared to periods of high volume.
- Market Still Reactive to Surprises: The February 4th short squeeze reminds us that the crypto market is highly reactive to unexpected price movements. Being aware of potential liquidation levels and market positioning is crucial.
Actionable Takeaway: While these metrics provide valuable insights into market sentiment and potential volatility, remember that they are just snapshots in time. The crypto market is dynamic and can change rapidly. Always combine these indicators with your own research, risk management strategies, and a broader understanding of market fundamentals.
Stay Informed, Trade Smarter
Understanding futures liquidations, volume trends, and options market sentiment can empower you to make more informed trading decisions. By keeping an eye on these indicators and combining them with other market analysis tools, you can navigate the crypto market with greater confidence and potentially identify opportunities while mitigating risks. Happy trading!
Related Posts – Ferrari joins the NFT universe through a collaboration with a Swiss…
Disclaimer: The information provided is not trading advice, Bitcoinworld.co.in holds no liability for any investments made based on the information provided on this page. We strongly recommend independent research and/or consultation with a qualified professional before making any investment decisions.