

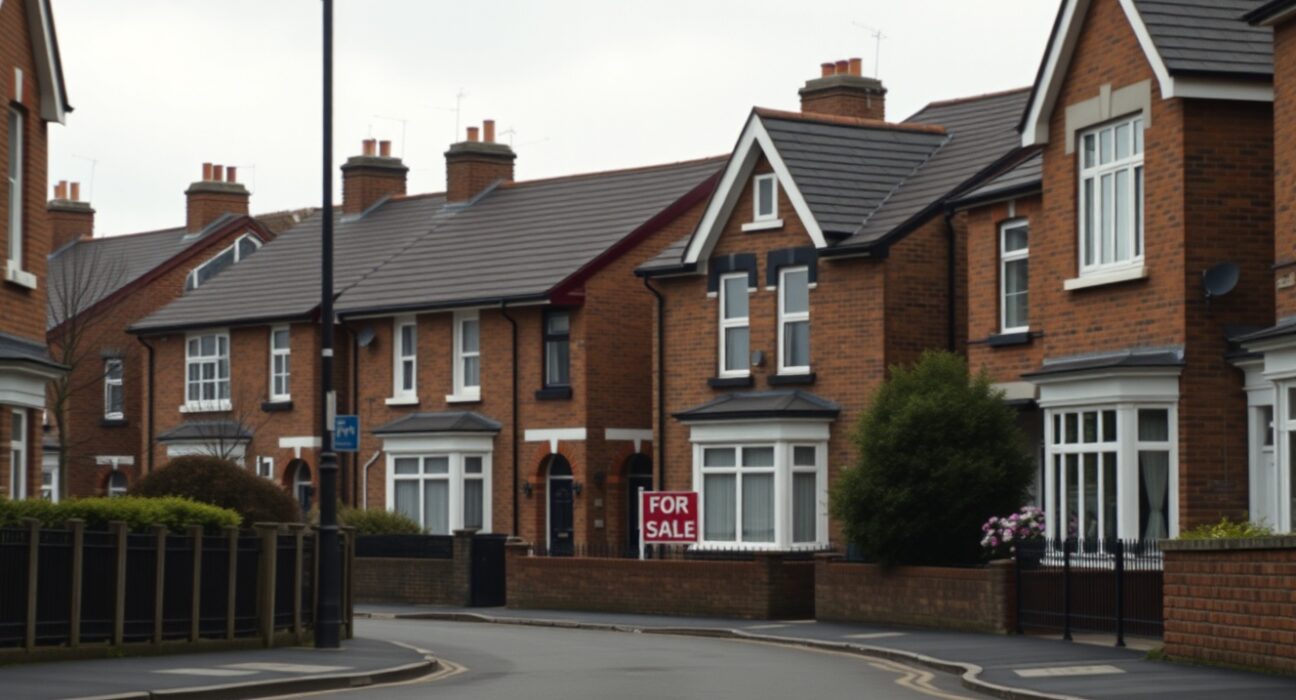
The United Kingdom’s Department for Communities and Local Government (DCLG) house price index recorded a year-on-year increase of 2.7% in May, a notable deceleration from the 3.8% growth observed in April. This latest data point signals a cooling trend in the UK housing market, reflecting broader economic pressures and shifting buyer sentiment.
What the DCLG Data Shows
The DCLG index, a key official measure of UK house prices based on mortgage completions, reported that average prices in May were 2.7% higher than the same month a year earlier. This represents the slowest annual growth rate in several months and marks a significant reduction from the more robust pace seen earlier in the year. The decline from April’s 3.8% figure underscores a clear slowdown in price appreciation, aligning with other indicators suggesting a market adjustment.
Context and Implications for the Housing Market
The slowdown in annual house price growth comes amid a complex economic backdrop. Elevated interest rates, set by the Bank of England to combat inflation, have increased mortgage costs, reducing affordability for many prospective buyers. This has dampened demand, particularly in higher-priced segments. Additionally, persistent cost-of-living pressures have curbed household budgets, leading to more cautious spending on large purchases like property.
Regional Variations and Market Dynamics
While the national index shows a clear slowdown, regional variations are likely. Typically, markets in London and the South East, which experienced the most rapid price growth in previous years, may see a more pronounced cooling. Conversely, more affordable regions in the North and Midlands could show relative resilience. The data also reflects a shift in buyer preference towards smaller, more affordable homes as mortgage rates remain elevated.
Why This Matters to Homeowners and Buyers
For current homeowners, the slowdown may temper expectations of rapid equity growth, though a 2.7% annual increase still represents positive price appreciation. For potential buyers, the easing of price growth, combined with a slight increase in property listings in some areas, could offer more negotiating power. However, higher borrowing costs remain a significant barrier. The data serves as a crucial indicator for policymakers, economists, and investors monitoring the health of the UK’s housing sector and its broader economic impact.
Conclusion
The decline in the DCLG house price index to 2.7% in May confirms a clear deceleration in the UK housing market. While prices remain above year-ago levels, the pace of growth has moderated considerably, influenced by higher interest rates and affordability constraints. This trend is expected to continue in the near term, with the market likely to remain subdued until economic conditions, particularly mortgage rates, show a more sustained improvement.
FAQs
Q1: What is the DCLG house price index?
The DCLG (Department for Communities and Local Government) house price index is an official UK statistic that tracks changes in the price of residential properties using data from mortgage completions. It is a widely cited measure of national and regional house price trends.
Q2: What does a 2.7% year-on-year increase mean?
It means that the average price of homes sold in May was 2.7% higher than the average price in May of the previous year. This is a measure of annual price growth, not a monthly change.
Q3: Why are house prices slowing down?
The primary factors are higher interest rates set by the Bank of England, which have increased mortgage costs, and the broader cost-of-living crisis, which has reduced household disposable income and buyer demand. This combination has cooled the market from the rapid growth seen in previous years.
Disclaimer: The information provided is not trading advice, Bitcoinworld.co.in holds no liability for any investments made based on the information provided on this page. We strongly recommend independent research and/or consultation with a qualified professional before making any investment decisions.
