

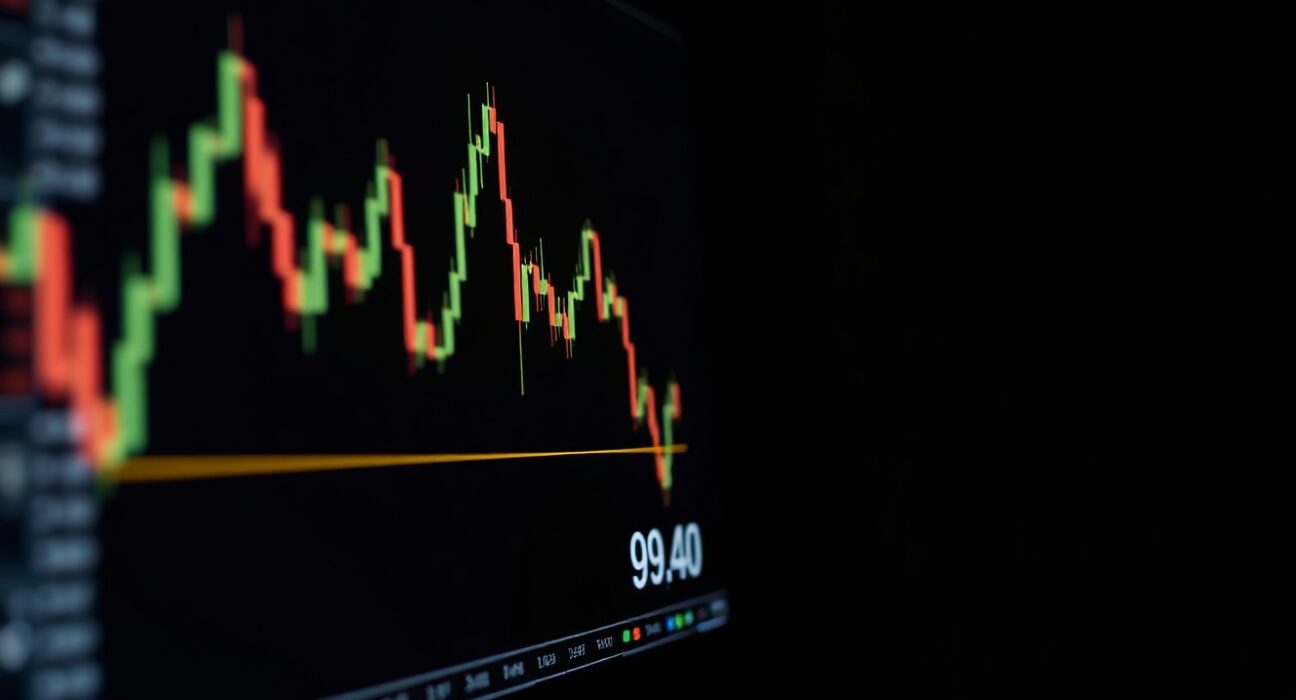
The US Dollar Index (DXY) is under renewed selling pressure, with bears targeting a two-month low near the 99.40 level as of the latest trading session. The index, which measures the dollar against a basket of six major currencies, has been declining amid shifting expectations for Federal Reserve policy and improving global risk sentiment.
What Is Driving the Dollar’s Decline?
The recent slide in the US Dollar Index reflects a combination of factors, including softer US economic data and growing market conviction that the Federal Reserve may begin cutting interest rates sooner than previously anticipated. As of this week, futures markets are pricing in a higher probability of a rate cut by September, which typically weighs on the dollar by reducing its yield appeal.
Additionally, risk-on sentiment in global markets has reduced demand for the safe-haven dollar. Equity indices have posted gains, and emerging market currencies have strengthened, further pressuring the greenback. Technical analysts note that the index has broken below several short-term support levels, paving the way for a test of the 99.40 region, a level not seen since mid-April.
Key Technical Levels to Watch
From a technical standpoint, the 99.40 area represents a critical support zone. It aligns with the 200-day moving average and a previous consolidation zone, making it a likely battleground for bulls and bears. A decisive break below this level could open the door to further downside, with the next major support around 98.80, a level that has held since March.
On the upside, immediate resistance is seen at 100.00, followed by the 20-day moving average near 100.50. A rebound from the 99.40 support would signal that the broader uptrend remains intact, but failure to hold could shift the medium-term outlook to bearish.
Why the 99.40 Level Matters for Traders
For traders and investors, the 99.40 level is more than just a number. It represents a confluence of technical and psychological factors that could determine the dollar’s trajectory in the coming weeks. A sustained break below this level could trigger stop-loss orders and algorithmic selling, accelerating the decline. Conversely, a strong bounce could restore confidence in the dollar and lead to a retest of recent highs.
Broader Market Implications
The dollar’s movement has ripple effects across global financial markets. A weaker dollar tends to support commodity prices, as they are priced in dollars, and can boost earnings for multinational companies that generate revenue abroad. It also affects central bank policies in emerging markets, where a softer dollar can ease inflationary pressures and provide room for rate cuts.
However, the dollar’s decline is not without risks. If the Fed delays rate cuts due to sticky inflation, the dollar could rebound quickly, catching many traders off guard. Therefore, while the technical setup favors bears in the near term, the fundamental picture remains nuanced.
Conclusion
In summary, the US Dollar Index is under pressure, with bears eyeing a move toward the 99.40 support level. The outcome of this test will likely shape the dollar’s direction in the near term, influenced by upcoming US economic data and Fed communications. Traders should monitor key levels and remain adaptable to changing market conditions.
FAQs
Q1: What is the US Dollar Index (DXY)?
The US Dollar Index (DXY) measures the value of the US dollar relative to a basket of six major currencies: the euro, Japanese yen, British pound, Canadian dollar, Swedish krona, and Swiss franc. It is a widely used benchmark for the dollar’s overall strength in global markets.
Q2: Why is the 99.40 level important for the dollar index?
The 99.40 level is a key technical support zone, aligning with the 200-day moving average and a prior consolidation area. A break below this level could signal further downside, while a bounce may indicate renewed bullish momentum.
Q3: How does a weaker dollar affect global markets?
A weaker dollar typically boosts commodity prices, benefits multinational companies with overseas revenue, and can ease financial conditions in emerging markets. However, it can also reflect concerns about the US economy or expectations of lower interest rates.
Disclaimer: The information provided is not trading advice, Bitcoinworld.co.in holds no liability for any investments made based on the information provided on this page. We strongly recommend independent research and/or consultation with a qualified professional before making any investment decisions.
