

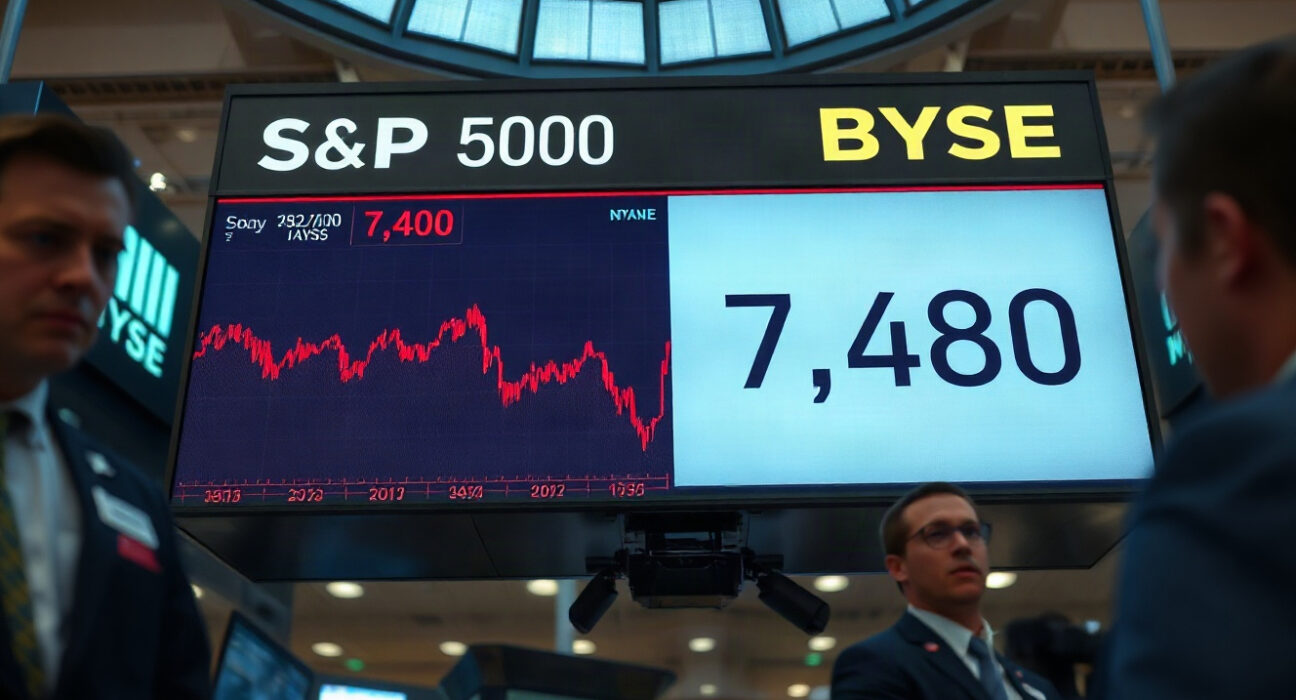
The S&P 500 rally has stalled, with bears now targeting a deeper correction toward the 7,480 level, according to recent technical analysis. As of this week, the index has failed to sustain its upward momentum, raising concerns among traders about a potential pullback from recent highs.
What’s Driving the Stalled Rally?
The pause in the S&P 500’s advance comes after a period of strong gains, driven by optimism around earnings and economic data. However, technical indicators now suggest that the index may be overbought in the short term, prompting profit-taking and a cautious stance among investors.
Key support levels are being watched closely, with 7,480 emerging as a critical downside target. This level represents a previous consolidation zone and could act as a magnet for sellers if the current weakness persists.
Technical Analysis: Key Levels to Watch
Chart patterns indicate that the S&P 500 is forming a potential bearish reversal, with lower highs and lower lows on the hourly and daily timeframes. The 50-day moving average is also flattening, a sign that the uptrend is losing steam.
Traders are now focusing on the 7,480 support level, which aligns with the 38.2% Fibonacci retracement of the recent rally. A break below this level could open the door for a more significant correction, possibly toward the 200-day moving average.
Implications for Investors
For investors, a correction toward 7,480 would represent a roughly 3-5% decline from current levels, depending on the exact entry point. While this may sound concerning, it is within the normal range of market volatility and could provide a buying opportunity for those with a longer-term horizon.
However, the uncertainty around interest rates, inflation, and geopolitical risks adds to the cautious tone. Market participants are advised to monitor upcoming economic data and Federal Reserve communications for further direction.
Conclusion
In summary, the S&P 500’s rally has stalled, and bears are eyeing a deeper correction toward 7,480. While the index remains in a broader uptrend, short-term technical signals suggest caution. Investors should watch key support levels and stay informed on macroeconomic developments to navigate the potential volatility.
FAQs
Q1: What does the 7,480 level represent for the S&P 500?
The 7,480 level is a key technical support zone, often identified by Fibonacci retracement levels and prior price consolidation. A drop to this level would indicate a moderate correction from recent highs.
Q2: Is a correction to 7,480 likely?
While technical indicators suggest the possibility, market movements are uncertain. The likelihood depends on factors such as earnings, economic data, and investor sentiment. Traders should watch for confirmation signals like a break below interim support.
Q3: How should investors react to a potential correction?
Investors should assess their risk tolerance and investment horizon. For long-term investors, a pullback could be a buying opportunity, while short-term traders may consider hedging strategies or reducing exposure. Always consult with a financial advisor.
Disclaimer: The information provided is not trading advice, Bitcoinworld.co.in holds no liability for any investments made based on the information provided on this page. We strongly recommend independent research and/or consultation with a qualified professional before making any investment decisions.
