

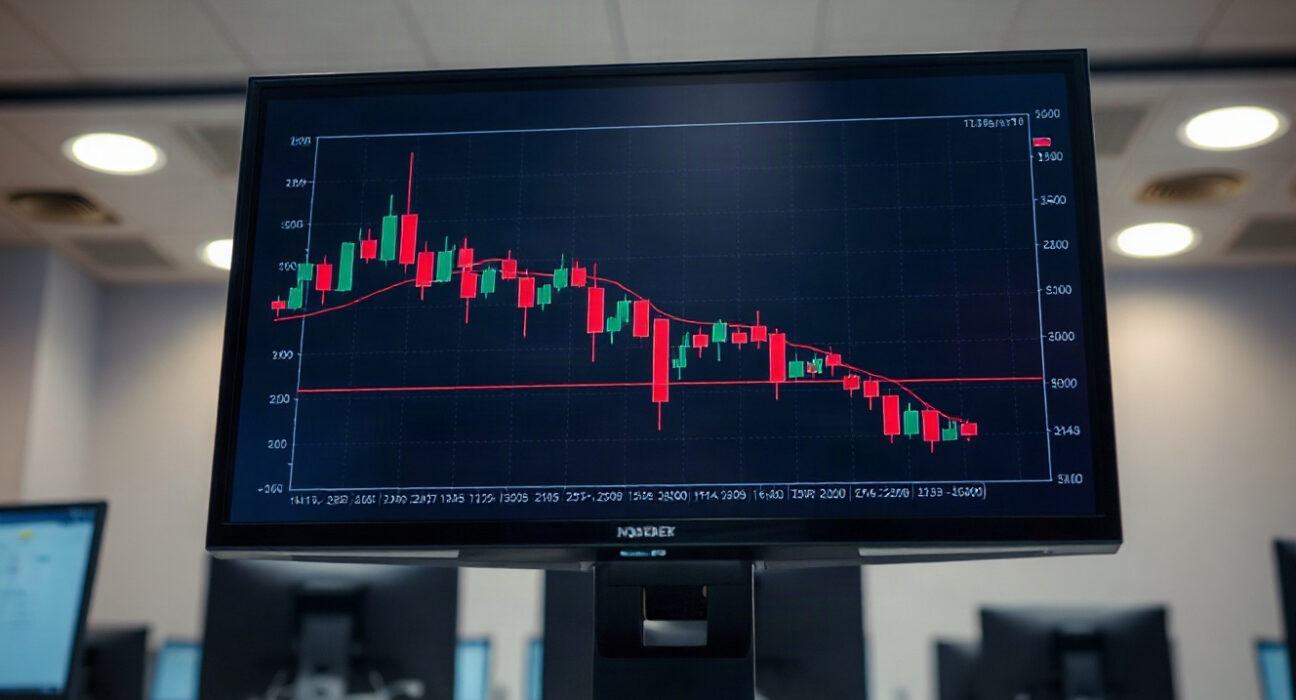
The USD/JPY pair continues to face strong resistance at the 20-day exponential moving average (EMA), as of the latest trading session, with the yen maintaining its recent strength against the dollar. This technical barrier has repeatedly capped upside attempts, keeping the pair within a tight range and signaling that sellers remain in control in the near term.
Why the 20-Day EMA Matters for USD/JPY
The 20-day EMA is a widely watched short-term trend indicator that traders use to gauge momentum and potential support or resistance levels. In the current USD/JPY setup, the pair has consistently failed to close above this moving average, indicating that the recent bearish momentum is still intact. As of this week, the 20-day EMA sits just above the current price, and each rally toward that level has been met with fresh selling pressure, reinforcing its role as a key barrier.
This technical pattern suggests that unless there is a decisive break above the 20-day EMA, the pair is likely to remain under pressure. A sustained move above this level could signal a shift in sentiment, but until then, traders are treating it as a sell zone. The repeated rejection at this moving average also reflects broader market dynamics, including the interest rate differential between the U.S. and Japan and the safe-haven demand for the yen amid global uncertainties.
Market Context and Broader Implications
The yen’s strength comes against a backdrop of shifting expectations for monetary policy. The Bank of Japan has signaled a gradual normalization of its ultra-loose policy, which has supported the yen. Meanwhile, the Federal Reserve’s path on interest rates remains uncertain, with market participants closely watching U.S. economic data for clues. These fundamental factors are aligning with the technical picture, as the yen benefits from a narrowing rate differential.
For traders, the 20-day EMA is not just a technical level but a reflection of the market’s current risk appetite. A failure to break above it could lead to further downside, with the next support levels likely to be tested. Conversely, a breakout would open the door for a retest of higher resistance zones. The ongoing tug-of-war between these forces is keeping the pair range-bound, and the resolution of this technical standoff will likely set the tone for the coming weeks.
What to Watch Next
Key levels to monitor include the recent swing lows and the psychological 150.00 mark, which has acted as a support zone in the past. On the upside, a close above the 20-day EMA would be the first sign of bullish momentum, followed by the 50-day EMA as the next hurdle. Fundamental catalysts, such as U.S. inflation data or comments from central bank officials, could also trigger a breakout or breakdown.
Given the current technical and fundamental alignment, the path of least resistance appears to be lower, but traders should remain flexible. The 20-day EMA will continue to be a critical level to watch, and a decisive move beyond it will likely define the next trend.
Conclusion
In summary, the USD/JPY pair is currently constrained by the 20-day EMA, which has proven to be a formidable barrier. The yen’s strength, driven by monetary policy expectations and safe-haven flows, is keeping the pair under pressure. Traders should monitor this level closely, as a break above or below could signal the next significant move. As always, combining technical analysis with fundamental context is essential for making informed trading decisions.
FAQs
Q1: What is the 20-day EMA and why is it important for USD/JPY?
The 20-day exponential moving average is a short-term trend indicator that smooths price data over the past 20 days, giving more weight to recent prices. For USD/JPY, it is currently acting as a resistance level, meaning the pair has struggled to rise above it, indicating bearish momentum.
Q2: What could cause a breakout above the 20-day EMA?
A breakout could be triggered by a shift in fundamental factors, such as a surprise change in U.S. or Japanese monetary policy, or a significant economic data release that alters market sentiment. A decisive close above the 20-day EMA would be the first technical confirmation of a bullish reversal.
Q3: How long can the 20-day EMA continue to cap the upside?
There is no set timeframe. The barrier will remain effective as long as sellers defend it. However, the longer the price stays below the EMA, the more likely a breakout becomes, as accumulation often occurs before a significant move. Traders should watch for volume and momentum indicators for clues.
Disclaimer: The information provided is not trading advice, Bitcoinworld.co.in holds no liability for any investments made based on the information provided on this page. We strongly recommend independent research and/or consultation with a qualified professional before making any investment decisions.
