
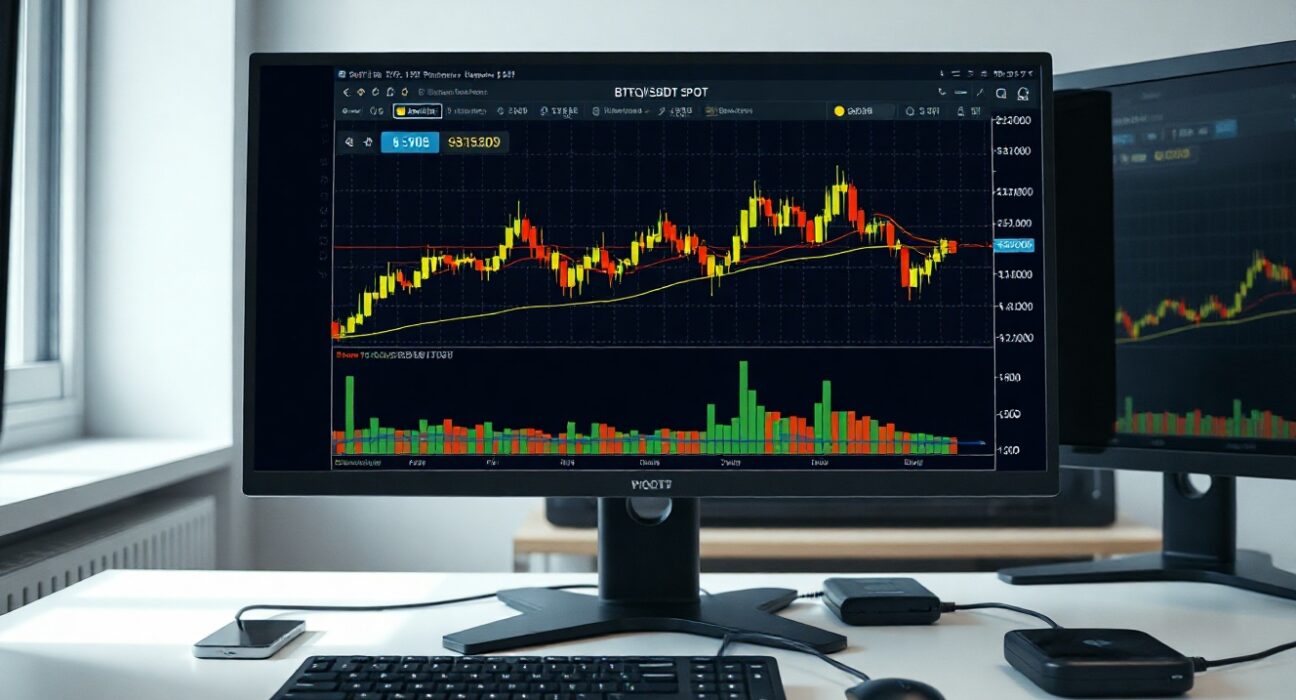
On June 6, Bitcoin World’s analysis of the BTC/USDT spot order book, using a Cumulative Volume Delta (CVD) chart, reveals nuanced shifts in buying and selling pressure. This technical tool, which tracks the volume of trades executed at the ask versus the bid price, offers traders a granular view of market momentum and potential support or resistance zones.
Understanding the CVD Chart Components
The chart is divided into two primary sections. The upper portion features a volume heatmap, which visualizes the intensity of trading activity at various price levels. Brighter colors on the heatmap indicate areas where the price has consolidated for an extended period or has moved through with significant volume. These zones often act as future support or resistance, as they represent price levels where a large number of orders were previously filled.
The lower section displays the Cumulative Volume Delta (CVD) indicator. This metric tracks the net difference between buying and selling volume, categorized by trade size. Each colored line represents a specific order size range. For instance, the yellow line tracks orders between $100 and $1,000, while the brown line monitors large institutional-sized orders between $1 million and $10 million. When a line rises, it indicates that buying pressure (market orders hitting the ask) is dominating for that trade size category.
Interpreting the June 6 Data
The current configuration of the CVD chart suggests a market where large-scale participants are showing distinct behavior compared to retail traders. The brown line, representing the largest order sizes, is showing a notable uptick, suggesting that institutional or whale-sized buyers are accumulating at current levels. This is a bullish signal, as it indicates that significant capital is being deployed.
Conversely, the yellow and orange lines, representing smaller retail orders, are relatively flat or declining. This divergence—where large players buy while smaller traders show less conviction—can often precede a significant price move. The volume heatmap is showing increased brightness around the $69,000 to $70,000 range, reinforcing this zone as a critical area where the market may find strong support.
What This Means for Traders
For traders, the current CVD setup provides a data-driven framework for risk management. The rising CVD in large order sizes suggests that any dip towards the $69,000 support zone could be met with buying interest. A break below this level, accompanied by a flattening of the brown CVD line, would signal that the institutional support is weakening, potentially leading to a deeper correction.
It is important to note that CVD is a lagging indicator and should not be used in isolation. Combining this data with volume profile analysis and price action can provide a more robust trading strategy. The key takeaway from the June 6 analysis is the bullish divergence between large and small order flows, which warrants close observation in the coming sessions.
Conclusion
The BTC/USDT spot CVD chart for June 6 highlights a potential accumulation phase by large-volume traders near the $69,000 support level. The divergence between institutional and retail order flow is a significant signal for the market. Traders should monitor the brown CVD line closely; its continued rise would reinforce the bullish outlook, while a reversal would signal caution.
FAQs
Q1: What is Cumulative Volume Delta (CVD)?
CVD is a technical indicator that tracks the net difference between buying and selling volume. It helps traders understand the aggressiveness of buyers versus sellers at different price levels and trade sizes.
Q2: How does the volume heatmap help in trading?
The volume heatmap visually represents trading activity at specific price levels. Brighter areas indicate high volume, which can act as future support or resistance zones because they represent price levels where a significant number of orders have been executed.
Q3: What does a rising CVD line for large orders indicate?
A rising CVD line for large order sizes (e.g., $1M-$10M) suggests that institutional or whale-sized traders are actively buying. This is often interpreted as a bullish signal, indicating strong demand from major market participants.
Disclaimer: The information provided is not trading advice, Bitcoinworld.co.in holds no liability for any investments made based on the information provided on this page. We strongly recommend independent research and/or consultation with a qualified professional before making any investment decisions.
