

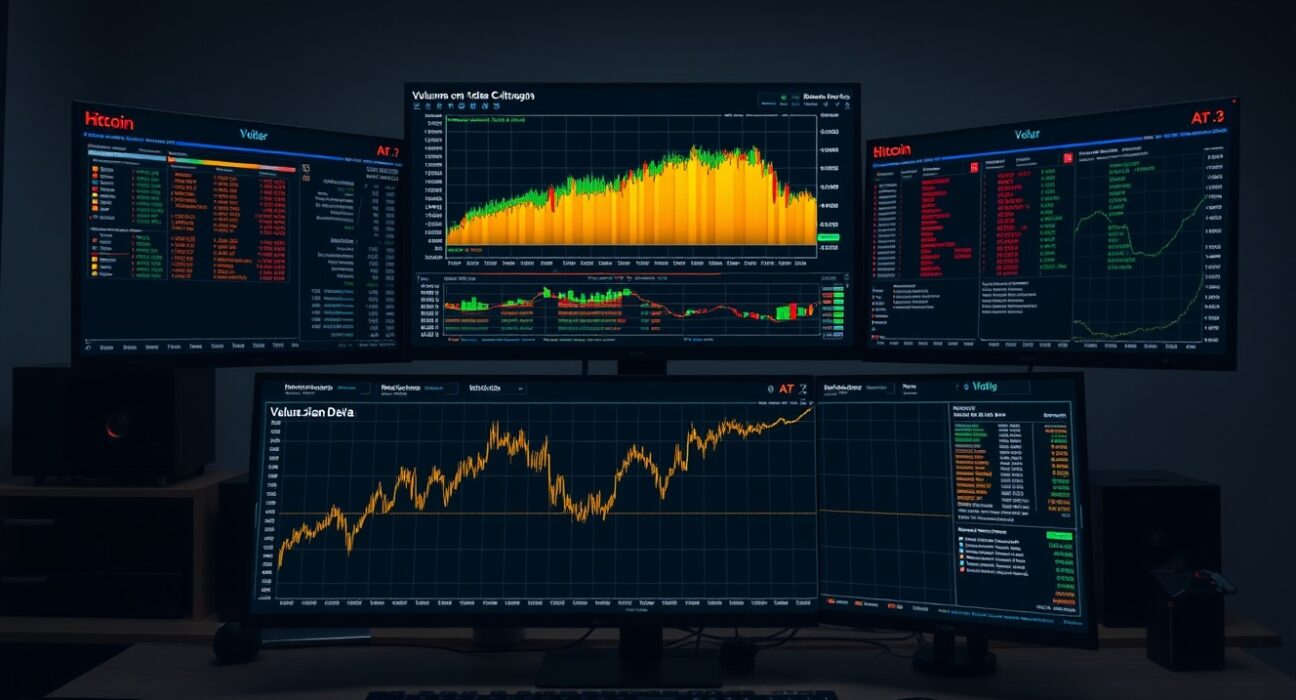
For traders monitoring Bitcoin’s price action, the Spot Cumulative Volume Delta (CVD) chart for the BTC/USDT trading pair on Binance offers a granular view of order book dynamics. The chart, which updates in real-time, is a critical tool for understanding the balance between buying and selling pressure at different price levels. This analysis focuses on the chart’s two primary components: the Volume Heatmap and the CVD line, providing context for the market structure leading into the July 21 observation period.
Understanding the Volume Heatmap
The upper panel of the chart displays a Volume Heatmap, which tracks trading activity across various price points. This visual tool uses color intensity to represent the amount of time the price has spent at a specific level or the velocity of price movement through that zone. Brighter, more intense colors indicate areas of high trading interest. These zones often act as future support or resistance, as they represent price levels where a significant amount of capital has been exchanged. Traders use these high-volume nodes to anticipate potential price reactions, making the heatmap a foundational layer for order flow analysis.
Interpreting Cumulative Volume Delta (CVD)
The lower panel of the chart presents the Cumulative Volume Delta, a metric that separates market orders into aggressive buys and sells. The CVD line rises when buying pressure exceeds selling pressure and falls when selling pressure dominates. This chart filters this data by order size, offering a nuanced view of market participation.
Order Size Segmentation
The chart distinguishes between different tiers of market participants. The yellow line tracks orders between $100 and $1,000, typically representing retail traders. In contrast, the brown line tracks large orders between $1 million and $10 million, which are often associated with institutional activity or large holders. By comparing the trajectory of these lines, analysts can gauge whether momentum is being driven by retail sentiment or large-scale capital flows. A divergence between the two, such as retail buying while institutions sell, can be a powerful signal of an impending trend reversal.
Why This Matters for July 21
As the chart resets at 12:00 a.m. UTC on July 21, the new data will provide a fresh snapshot of market positioning. This is particularly relevant in the current market environment, where Bitcoin’s price is testing key technical levels. The CVD data can help traders confirm whether a breakout or breakdown is supported by genuine order flow or if it is merely a result of low-liquidity manipulation. Understanding the interplay between the Volume Heatmap and CVD lines allows for more informed decision-making, moving beyond simple price action to a deeper comprehension of market microstructure.
Conclusion
The Spot CVD chart for BTC/USDT is more than a simple price tracker; it is a window into the real-time battle between buyers and sellers. By combining the visual cues of the Volume Heatmap with the order-flow data of the CVD, traders can develop a more robust understanding of market sentiment. As the new trading session begins on July 21, this tool will be essential for anyone looking to navigate the complexities of the Bitcoin spot market.
FAQs
Q1: What does a rising CVD line indicate?
A rising Cumulative Volume Delta (CVD) line indicates that aggressive buying pressure is exceeding selling pressure at the current market price. This suggests that market participants are willing to pay higher prices to enter positions, which is generally a bullish signal.
Q2: How is the Volume Heatmap different from a standard volume indicator?
While a standard volume indicator shows total trading activity over a time period, the Volume Heatmap plots volume at specific price levels. This reveals which price zones have the highest concentration of trading activity, helping to identify potential support and resistance levels that might not be visible on a standard chart.
Q3: Why is it important to look at CVD by order size?
Analyzing CVD by order size helps distinguish between retail and institutional activity. Large orders ($1M-$10M) can move the market significantly, while small orders ($100-$1,000) represent general retail sentiment. A divergence between these two lines can provide early warning of a potential trend change.
Disclaimer: The information provided is not trading advice, Bitcoinworld.co.in holds no liability for any investments made based on the information provided on this page. We strongly recommend independent research and/or consultation with a qualified professional before making any investment decisions.
