

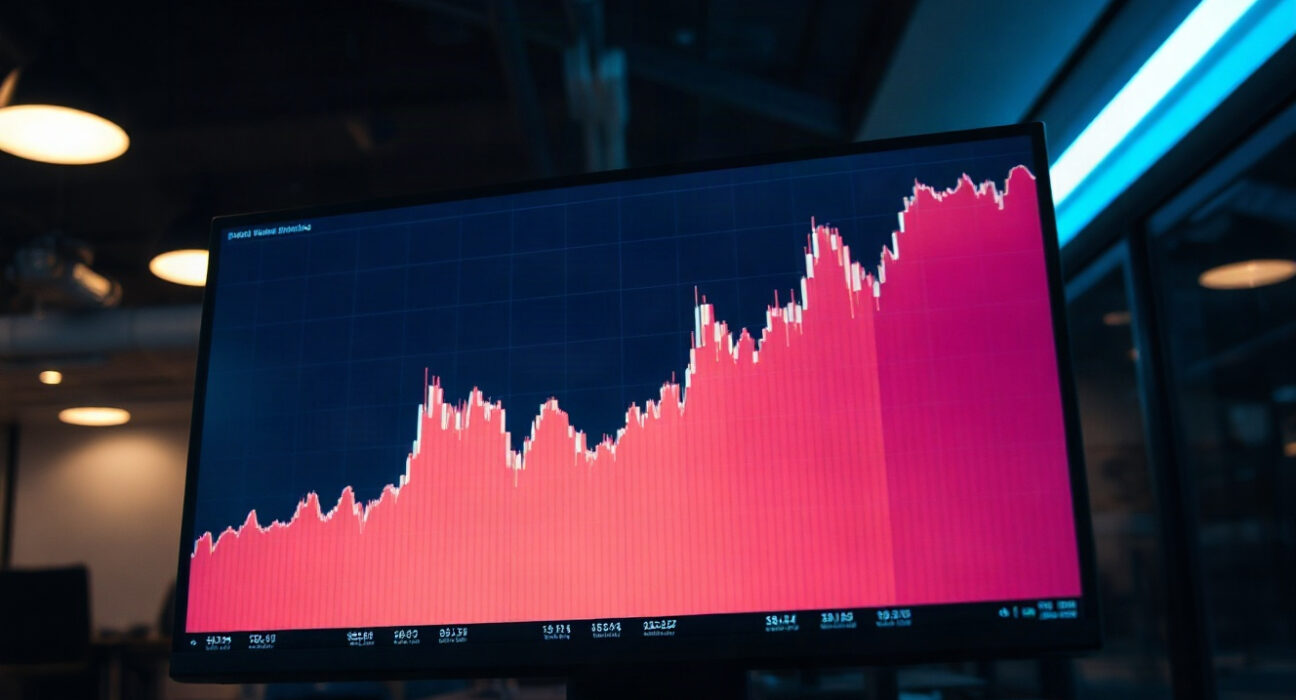
On Sept. 2 at 3:00 p.m. UTC, the BTC/USDT spot order book displayed a notable configuration of buy and sell pressure, as captured by the cumulative volume delta (CVD) indicator and volume heatmap. These tools, widely used by traders to gauge real-time market sentiment, offer a granular view of how orders are executed across price levels and by fund size.
Understanding the CVD and Volume Heatmap
The upper panel of the chart presents a volume heatmap, which visualizes trading activity across various price ranges. Brighter areas on the heatmap indicate price levels where the asset has either remained for an extended period or experienced significant movement. These zones often evolve into support or resistance levels, as traders remember the activity and place orders accordingly.
The lower panel tracks cumulative volume delta, a metric that reflects the net difference between aggressive buying and selling. The chart distinguishes orders by size, with the yellow line representing trades between $100 and $1,000, and the brown line corresponding to large orders between $1 million and $10 million. When the line moves upward, it signals that buy orders are dominating at that particular fund size.
What the Sept. 2 Data Showed
At the specified time, the CVD lines for both small and large order sizes were exhibiting divergent trends, a pattern that often indicates mixed sentiment among retail and institutional participants. The yellow line, tracking smaller orders, showed a gradual uptick, suggesting consistent accumulation by retail traders. In contrast, the brown line, representing large orders, appeared to flatten or slightly decline, hinting at a cautious stance among larger market players.
The volume heatmap for the session highlighted a dense cluster of trading activity just below the current price, which could serve as a support level in the near term. Meanwhile, a thinner zone above suggested relatively weak resistance, potentially allowing for upward movement if buying pressure intensifies.
Why This Matters for Traders
For active traders, the combination of CVD and volume heatmap provides actionable intelligence beyond simple price charts. The divergence between small and large order flows can be an early signal of shifting market dynamics. If large orders begin to align with retail buying, it could confirm a stronger bullish trend. Conversely, if large orders continue to lag, any upward move may lack the institutional backing needed for sustainability.
It is important to note that these indicators are not predictive on their own. They reflect past and current order flow, and market conditions can change rapidly, especially in the volatile cryptocurrency space. Traders should use this information in conjunction with broader technical analysis and risk management strategies.
Conclusion
The BTC spot CVD and volume heatmap data from Sept. 2 offer a snapshot of order flow dynamics that can inform trading decisions. While the data points to a cautious but active market, with retail participation slightly ahead of institutional moves, the overall picture remains fluid. As always, traders are advised to monitor these indicators over time to identify more definitive trends.
FAQs
Q1: What is cumulative volume delta (CVD) in cryptocurrency trading?
CVD is an indicator that measures the net difference between aggressive buying and selling volume over a given period. It helps traders understand whether buyers or sellers are more active at a given time, based on executed orders.
Q2: How does the volume heatmap help in identifying support and resistance?
The volume heatmap shows price levels where significant trading activity has occurred. Brighter areas indicate high volume, which often act as support (if price is above) or resistance (if price is below), because traders remember these levels and place orders there.
Q3: Why is it important to track order sizes in CVD analysis?
Tracking order sizes, such as small ($100-$1,000) versus large ($1M-$10M) orders, helps distinguish between retail and institutional activity. This can reveal whether market moves are driven by individual traders or larger players, providing insight into the strength and potential sustainability of a trend.
Disclaimer: The information provided is not trading advice, Bitcoinworld.co.in holds no liability for any investments made based on the information provided on this page. We strongly recommend independent research and/or consultation with a qualified professional before making any investment decisions.
