

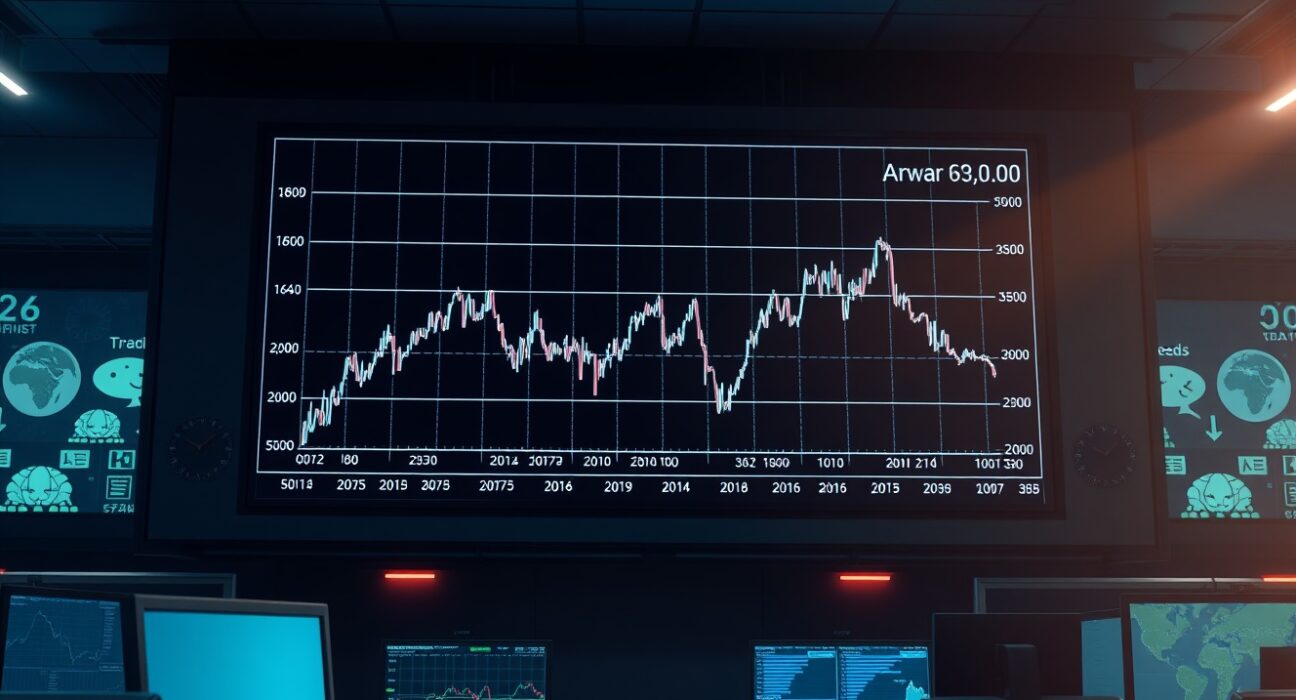
The Dow Jones Industrial Average (DJIA) is sending a signal that would have been unthinkable to earlier generations of traders: the old playbook for how markets react to geopolitical conflict has effectively been turned on its head. Historically, the onset or escalation of war has triggered a predictable flight to safety, a sell-off in equities, and a surge in commodities like gold and oil. But recent chart patterns suggest that correlation has weakened, and in some cases, reversed entirely.
A Historical Pattern Under Pressure
For decades, the conventional wisdom held that war was unequivocally bearish for stocks. The outbreak of World War I, the Korean War, and the initial shock of the 1973 Yom Kippur War all saw the Dow drop sharply. Investors would sell risk assets and pile into government bonds and precious metals. The logic was simple: conflict destroys infrastructure, disrupts supply chains, and creates uncertainty that chills business investment.
However, the past several years have challenged that narrative. The Dow has shown a tendency to rally or remain resilient during periods of heightened geopolitical tension, including the 2022 Russian invasion of Ukraine and the 2023 conflict in Gaza. This has left analysts questioning whether the old cause-and-effect relationship has fundamentally changed or if the market is simply pricing in a new set of assumptions.
What the Charts Are Saying Now
Technical analysis of the Dow’s price action reveals a pattern that looks like a mirror image of historical war-time reactions. Instead of a sharp initial decline followed by a recovery, the index has shown a muted initial reaction, followed by a period of sustained upward drift. The volatility index (VIX), often called the fear gauge, has also failed to spike to the levels seen in previous conflicts, suggesting that the market’s collective anxiety is being priced differently.
One possible explanation is the changing nature of modern warfare. Conflicts today are often more localized, involve fewer major industrial powers, and are fought with different economic tools. Sanctions and financial warfare have become primary weapons, which can have a more immediate and direct impact on currency and commodity markets than on broad equity indices.
The Role of Central Banks and Fiscal Policy
Another critical factor is the unprecedented level of central bank intervention. Since the 2008 financial crisis, the Federal Reserve and other major central banks have maintained a posture that is highly accommodative during crises. This has created a ‘Fed put’ mentality, where investors believe that any significant market downturn will be met with policy support. This safety net has fundamentally altered the risk-reward calculation for equities during geopolitical shocks.
Furthermore, the massive fiscal stimulus deployed during the COVID-19 pandemic flooded the system with liquidity, which has found its way into risk assets. This liquidity overhang may be dampening the traditional selling pressure that would accompany a war-related shock.
Why This Matters to Investors
For long-term investors, the breakdown of the old war playbook means that historical precedents are less reliable as a guide. Relying on the assumption that conflict will automatically lead to a stock market decline could be a costly mistake. Instead, investors need to focus on the specific economic context of each conflict, including the exposure of major companies, the state of global supply chains, and the response of monetary and fiscal authorities.
The Dow’s current behavior suggests that the market is treating geopolitical risk as a more nuanced variable than in the past. It is not ignoring war, but it is filtering it through a lens of liquidity, policy support, and the shifting nature of global power dynamics.
Conclusion
The Dow Jones Industrial Average’s recent defiance of historical war-time patterns is not a sign that markets have become immune to conflict. Rather, it is a reflection of a more complex and interconnected global financial system. The old playbook is being rewritten in real-time, and investors who fail to adapt may find themselves caught off guard. The charts are telling a story of inversion, but the final chapter is far from written.
FAQs
Q1: Why is the Dow Jones rising during conflicts when it used to fall?
Several factors are at play, including massive central bank liquidity, a ‘Fed put’ mentality, and the changing nature of modern conflicts that are often more localized and less disruptive to global industrial production than past wars.
Q2: Is the old war playbook completely obsolete for stock investors?
Not entirely, but it is less reliable. The historical correlation between war and falling stocks has weakened. Investors should analyze each conflict’s specific economic context rather than relying on broad historical assumptions.
Q3: What should I look for in the charts to understand market reaction to geopolitical events?
Pay attention to the VIX (volatility index), the performance of defensive sectors versus cyclical sectors, and the reaction of commodity prices like oil and gold. A muted VIX response often indicates that the market is not pricing in a prolonged or severe conflict.
Disclaimer: The information provided is not trading advice, Bitcoinworld.co.in holds no liability for any investments made based on the information provided on this page. We strongly recommend independent research and/or consultation with a qualified professional before making any investment decisions.
