

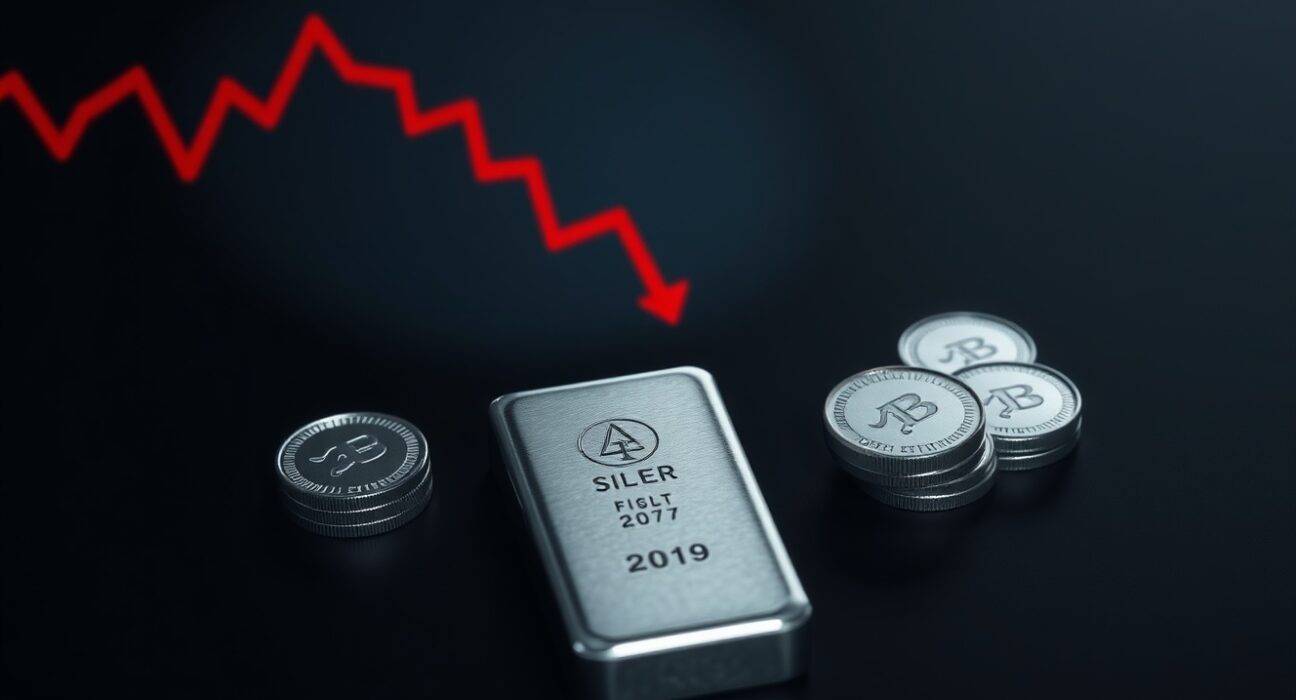
Silver (XAG/USD) continues to trade within a defined technical pattern of lower highs, a structure that has kept the precious metal under bearish pressure. As of the latest session, bears are increasingly targeting the $55 per ounce level, a key downside objective that has drawn attention from technical analysts and commodity traders alike.
Lower Highs Pattern Signals Persistent Bearish Sentiment
The lower highs formation on the daily chart reflects a series of declining peaks, each failing to surpass the previous one. This pattern typically indicates that selling pressure is gradually overwhelming buying momentum, a dynamic that has been in place for silver over recent weeks. The inability of buyers to push prices above established resistance levels has reinforced the bearish outlook, with each rally attempt meeting fresh selling interest.
This technical setup is not a sudden development but rather a continuation of a trend that has been building. The persistence of this structure suggests that the market is not yet ready for a reversal, and any near-term bounces are likely to be met with renewed selling pressure.
Key Support and Resistance Levels
From a technical perspective, silver is currently testing intermediate support levels that could determine the speed of the move toward $55. A decisive break below the immediate support zone would open the path toward the psychological $55 handle, a level that previously acted as a pivot point for the metal. On the upside, resistance is now clustered around the most recent lower high, which serves as a critical barrier for any bullish recovery attempt.
Traders are closely watching these levels, as a close below the current support could accelerate selling, while a break above the recent lower high would invalidate the bearish structure in the near term. However, the prevailing momentum favors the bears, and a test of $55 appears increasingly plausible unless a significant shift in fundamental sentiment occurs.
What a Move to $55 Means for the Broader Market
A decline to $55 would represent a substantial correction from recent highs and would likely have implications for the broader precious metals complex. Gold, often correlated with silver, could also face pressure if the silver sell-off deepens, though divergences do occur. For industrial users of silver, a lower price could be a welcome development, potentially boosting demand from sectors such as electronics and solar energy manufacturing. Conversely, silver miners and producers would face margin compression at these levels.
The $55 target is not an arbitrary number; it corresponds to prior technical support and a zone where the metal previously consolidated. A revisit of this area would bring silver back to levels last seen in early 2024, underscoring the magnitude of the current bearish phase.
Conclusion
The lower highs structure in silver remains intact, keeping the bearish bias firmly in place. With sellers in control and resistance levels holding, the path of least resistance points toward a test of $55. Traders should monitor the key support zone closely, as a breakdown could accelerate the decline. While a reversal is always possible, the current technical evidence does not yet support a bullish case.
FAQs
Q1: What does a ‘lower highs’ pattern mean for silver?
A lower highs pattern indicates that each price peak is lower than the previous one, suggesting that sellers are gaining control and that the overall trend is bearish. It is a classic sign of weakening upward momentum.
Q2: Why is the $55 level important for silver?
The $55 level is a key psychological and technical support zone. It previously acted as a consolidation area and a pivot point. A break below it could open the door to further declines, while holding above it could slow the bearish momentum.
Q3: Could the silver price reverse and move higher instead?
A reversal is possible if buyers manage to push the price above the most recent lower high. However, until that resistance is broken, the bearish structure remains dominant, and any rallies are likely to be sold into.
Disclaimer: The information provided is not trading advice, Bitcoinworld.co.in holds no liability for any investments made based on the information provided on this page. We strongly recommend independent research and/or consultation with a qualified professional before making any investment decisions.
