
2026-06-01
On May 29, the Spot Cumulative Volume Delta (CVD) chart for the BTC/USDT trading pair provided traders with a detailed view of order.

On May 29, the Spot Cumulative Volume Delta (CVD) chart for the BTC/USDT trading pair provided traders with a detailed view of order.

On May 27, 2024, at 00:00 UTC, the spot cumulative volume delta (CVD) chart for the BTC/USDT trading pair presents a detailed view.

Traders monitoring the Bitcoin spot market have a fresh data point to consider this morning. A detailed analysis of the BTC/USDT order book,.

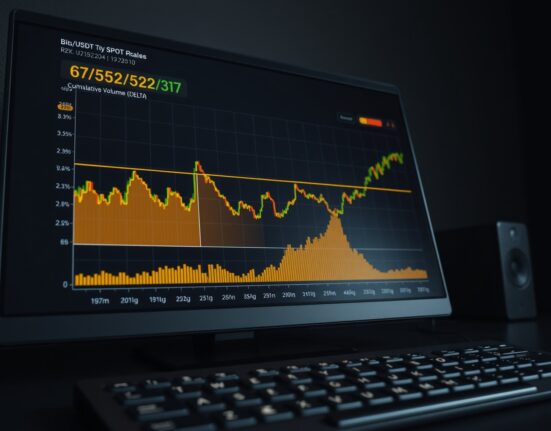
For traders monitoring Bitcoin’s spot market, the BTC/USDT Cumulative Volume Delta (CVD) chart offers a detailed look into real-time order flow. By combining.

Traders closely monitor the BTC spot CVD chart for May 1 as it reveals critical shifts in buying and selling pressure. The spot.
Traders closely monitor the BTC/USDT spot CVD chart as of 11:00 a.m. UTC, Apr. 30, 2025. This chart provides a detailed analysis of.

In a move that has captured the attention of the entire cryptocurrency derivatives market, a highly successful trader on the Hyperliquid perpetual futures.

Have you ever wondered if cryptocurrency markets are being manipulated right before your eyes? CryptoQuant CEO Ki Young Ju just dropped a bombshell.

In an extraordinary market movement that has captured global attention, Bitcoin has achieved a stunning breakthrough by climbing above $95,000. According to Bitcoin.

The cryptocurrency world is buzzing with excitement as Bitcoin achieves a remarkable milestone, breaking through the $96,000 barrier in a stunning display of.