

2026-06-30
On June 30, the BTC/USDT spot Cumulative Volume Delta (CVD) chart provided traders with a detailed view of order book dynamics and volume.

On June 30, the BTC/USDT spot Cumulative Volume Delta (CVD) chart provided traders with a detailed view of order book dynamics and volume.

The Australian dollar remains under pressure against the US dollar, with technical indicators pointing to a likely extension of the current decline below.

The GBP/JPY currency pair is showing signs of a technical breakout as an ascending triangle pattern develops on the daily chart, putting the.
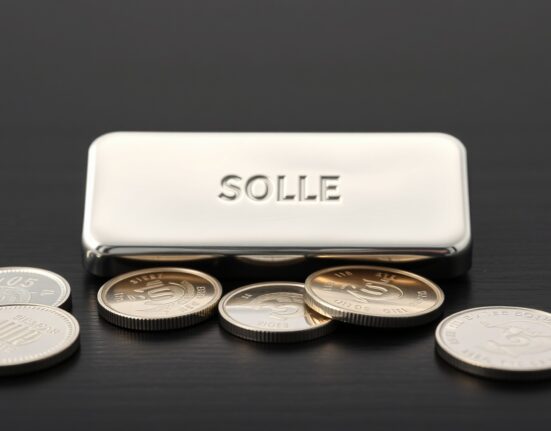
Silver prices (XAG/USD) continue to trade below the psychologically significant $60 mark, as technical indicators flash warning signs of a potential ‘death cross’.

The USD/JPY currency pair continues to trade in a tight range below the 162.00 threshold, as persistent fears of Japanese intervention cap any.

The USD/CAD currency pair is holding losses below the 1.4200 level in early trading this week, as technical indicators flash overbought signals following.

The EUR/USD currency pair continues to face headwinds near the 1.1400 mark, struggling to build upward momentum as geopolitical uncertainties keep risk appetite.
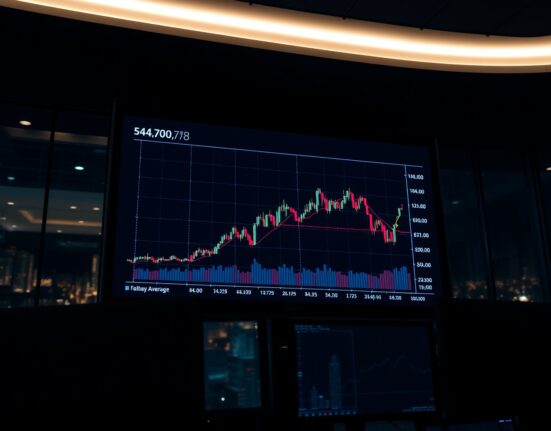
The EUR/JPY cross edged higher in early European trading on Wednesday, briefly trading above the 184.00 mark. However, the pair remains under a.

Bitcoin faces the prospect of a steep decline if it breaches the psychologically important $60,000 support level, according to multiple market analysts cited.
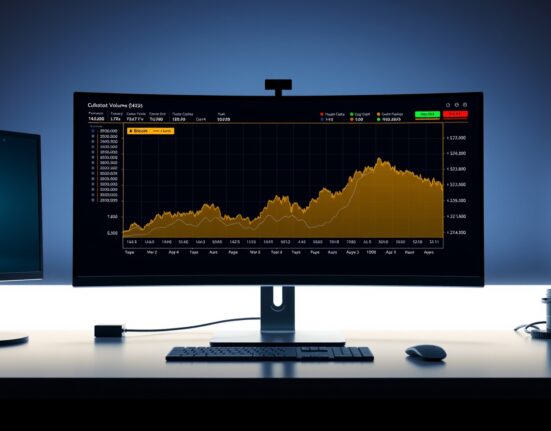
As of 12:30 a.m. UTC on June 29, 2025, the spot cumulative volume delta (CVD) chart for the BTC/USDT pair on major exchanges.