

2026-07-01
On July 1, at 11 a.m. UTC, the BTC/USDT spot market is presenting a detailed picture of order flow dynamics through the Cumulative.
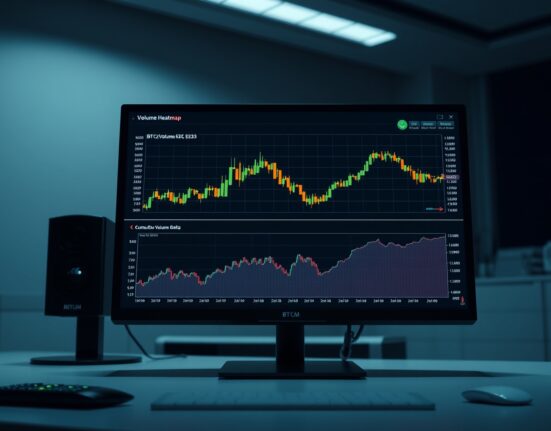
On July 1, at 11 a.m. UTC, the BTC/USDT spot market is presenting a detailed picture of order flow dynamics through the Cumulative.

On June 25 at 10 a.m. UTC, the spot Cumulative Volume Delta (CVD) chart for the BTC/USDT pair provides a detailed look into.

For traders monitoring Bitcoin price action on Binance or similar exchanges, the spot Cumulative Volume Delta (CVD) chart for the BTC/USDT pair has.

On June 17, traders analyzing the BTC/USDT spot market are closely monitoring the Spot Cumulative Volume Delta (CVD) chart, a tool that provides.

On June 11 at 0:00 UTC, the BTC/USDT spot pair’s Cumulative Volume Delta (CVD) chart offers traders a granular view of order book.
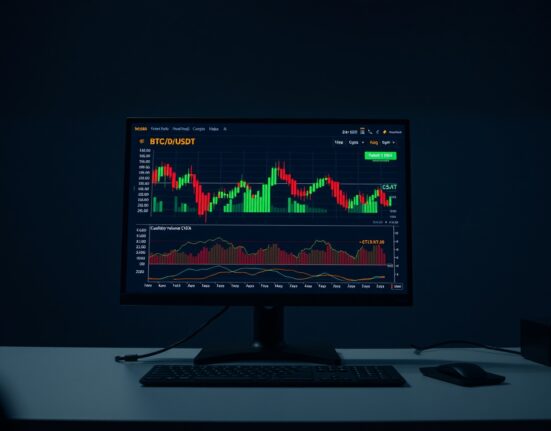
The Spot Cumulative Volume Delta (CVD) chart for the BTC/USDT spot pair provides traders with a granular view of order book dynamics, tracking.
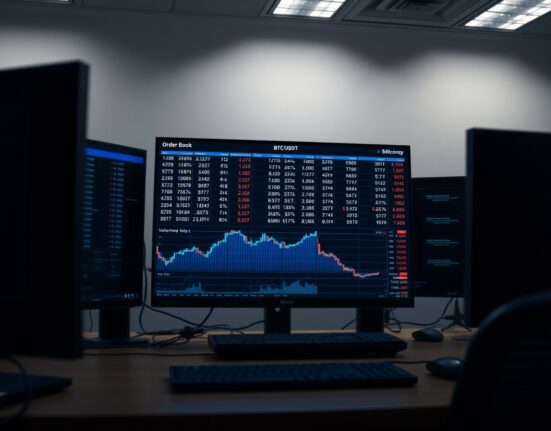
On May 29, the Spot Cumulative Volume Delta (CVD) chart for the BTC/USDT trading pair provided traders with a detailed view of order.

On May 30, the BTC/USDT spot pair displayed notable activity in its order book, as reflected in the Cumulative Volume Delta (CVD) and.
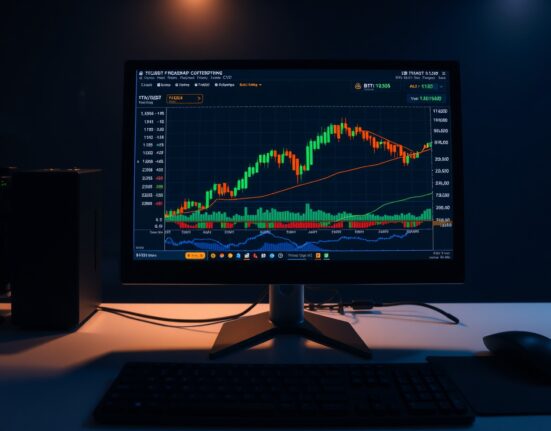
The Spot Cumulative Volume Delta (CVD) chart has become an essential tool for traders analyzing the BTC/USDT spot market. Unlike simple price charts,.

As of 10:00 a.m. UTC on May 25, 2025, the BTC/USDT spot pair is showing notable activity in its order book, as visualized.