
Is Bitcoin Back in Charge? Bitcoin Dominance Hints at a Potential Bullish Reversal
In the ever-exciting world of cryptocurrency, where fortunes can shift in the blink of an eye, one metric is starting to whisper some intriguing possibilities: Bitcoin Dominance (BTCD). For those new to the crypto lingo, Bitcoin dominance essentially tells us what percentage of the total cryptocurrency market capitalization belongs to Bitcoin. Think of it as Bitcoin’s slice of the crypto pie. And recent technical analysis suggests that Bitcoin’s slice might be about to get bigger!
Crypto enthusiasts and seasoned traders are buzzing about potential shifts in market dynamics. Could we be seeing a resurgence of Bitcoin’s reign? Let’s dive into what the charts are telling us and what it could mean for the crypto landscape.
Decoding the Bitcoin Dominance Chart: What’s the Buzz?
According to technical indicators, Bitcoin Dominance (BTCD) appears to be gearing up for a significant bullish reversal. Let’s break down the key signals that are catching the attention of analysts:
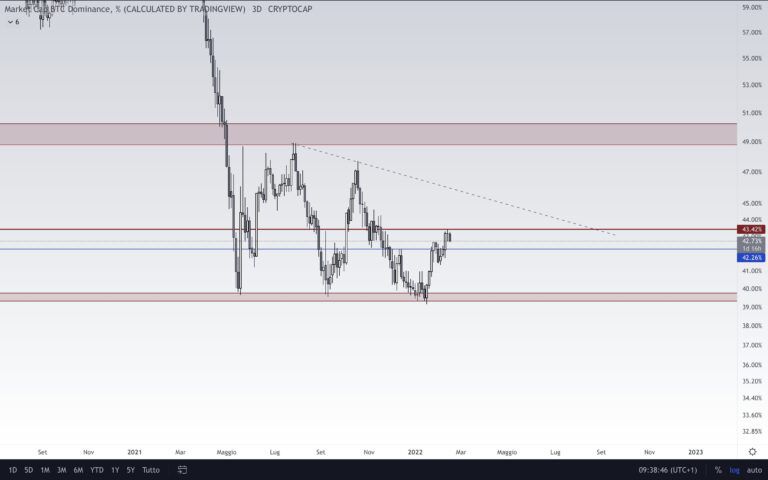
- Strong Support at 40%: The weekly chart reveals a crucial support level around the 40% mark. BTCD has consistently bounced back from this level multiple times – in May, September, and January 2022. This isn’t just a recent phenomenon; since early 2018, Bitcoin’s dominance hasn’t dipped below this critical horizontal zone. This repeated bounce suggests strong underlying demand and a potential floor for Bitcoin dominance.
- Bullish Divergences on Key Indicators: Technical analysts are particularly excited about the bullish divergences observed in the Relative Strength Index (RSI) and the Moving Average Convergence Divergence (MACD) on the weekly chart. These divergences are considered strong signals of a potential trend reversal. Think of it like this: while the price action might be showing weakness or consolidation, the momentum indicators are hinting at building underlying strength. Such divergences on a weekly timeframe are not common and add weight to the bullish argument.
- Fibonacci Retracement Levels in Focus: If this bullish momentum continues, the first significant long-term resistance level to watch out for is around 52.25%. This level is derived from the 0.382 Fibonacci retracement, a commonly used tool by traders to identify potential resistance points. Overcoming this level could signal a more substantial and sustained upward trend for Bitcoin dominance.
Adding to the analysis, prominent cryptocurrency trader @eliz883 shared a BTCD chart, projecting a potential rise towards a falling resistance line near 45%. This independent analysis further reinforces the idea of an imminent upward movement in Bitcoin dominance.
Source : TradingView
Zooming into the Daily Chart: Confirming the Bullish Outlook
The bullish signals observed on the weekly chart are further corroborated when we zoom into the daily timeframe. Let’s examine what the daily chart reveals:
- Reclaiming the 40% Level: The daily chart shows that BTCD briefly dipped below the 40% area (highlighted in green in the chart) before swiftly reclaiming it. This is often seen as a positive sign in technical analysis, sometimes preceding price increases. It suggests a temporary dip that was quickly bought up, indicating underlying strength.
- Breakout from Descending Resistance: Shortly after reclaiming the 40% level, BTCD broke out of a descending resistance line. This breakout is another bullish signal, suggesting that the downward pressure is easing and the price is ready to move higher.
- Facing Resistance at 43.50% and 0.5 Fib Level: BTCD has managed to reach a local high of 43.50%, but it encountered resistance at the 0.5 Fibonacci retracement level. This is a natural point of resistance, and overcoming it would be the next hurdle in confirming the bullish trend on the daily chart.
What Does a Rising Bitcoin Dominance Mean for the Crypto Market?
If Bitcoin dominance continues its upward trajectory, what could it mean for the broader cryptocurrency market? Here are a few potential implications:
- Altcoin Season on Hold (Potentially): A rising Bitcoin dominance often suggests that Bitcoin is outperforming altcoins. This could mean that the highly anticipated “altcoin season,” where altcoins see explosive growth, might be delayed or less pronounced. Investors might be rotating back into Bitcoin, seeking relative safety or perceived value.
- Flight to Safety: In times of market uncertainty or volatility, investors often flock to Bitcoin as a perceived safe haven within the crypto space. A rise in Bitcoin dominance could indicate increased risk aversion and a preference for the more established cryptocurrency.
- Renewed Focus on Bitcoin Fundamentals: A period of increasing Bitcoin dominance could also signal a renewed focus on Bitcoin’s core value proposition – as a store of value, a decentralized currency, and a hedge against traditional financial systems.
- Potential Bitcoin Price Increase: While not directly correlated, historically, periods of strong Bitcoin dominance have sometimes coincided with significant Bitcoin price appreciation. If capital flows back into Bitcoin, it could contribute to upward price pressure.
Is Now the Time to Re-evaluate Your Crypto Portfolio?
The signals emerging from Bitcoin dominance charts are definitely worth paying attention to, especially for crypto traders and investors. While technical analysis is not foolproof and market predictions are never guaranteed, these indicators suggest a potential shift in market dynamics.
Here are some actionable insights to consider:
- Monitor BTCD Closely: Keep an eye on Bitcoin dominance charts, particularly the weekly and daily timeframes. Track its movement relative to the key levels mentioned (40%, 45%, 52.25%).
- Assess Altcoin Holdings: If you have a significant portion of your portfolio in altcoins, consider reviewing their performance relative to Bitcoin in the current market environment. A rising BTCD might warrant a more cautious approach to altcoin investments.
- Stay Informed: Keep up-to-date with market analysis from reputable sources and consider how Bitcoin dominance trends might impact your overall crypto strategy.
Conclusion: Bitcoin Dominance – A Metric Worth Watching
The potential bullish reversal in Bitcoin dominance is an intriguing development in the cryptocurrency market. While it’s crucial to remember that technical analysis provides probabilities, not certainties, the confluence of bullish signals across multiple timeframes and indicators suggests a shift in momentum. Whether this translates into a sustained period of Bitcoin outperformance remains to be seen. However, Bitcoin dominance is undoubtedly a metric that crypto enthusiasts, traders, and investors should closely monitor in the coming weeks and months. It could provide valuable insights into the evolving dynamics of the crypto market and inform strategic portfolio decisions.
Related Posts – Ferrari joins the NFT universe through a collaboration with a Swiss…
Disclaimer: The information provided is not trading advice, Bitcoinworld.co.in holds no liability for any investments made based on the information provided on this page. We strongly recommend independent research and/or consultation with a qualified professional before making any investment decisions.