

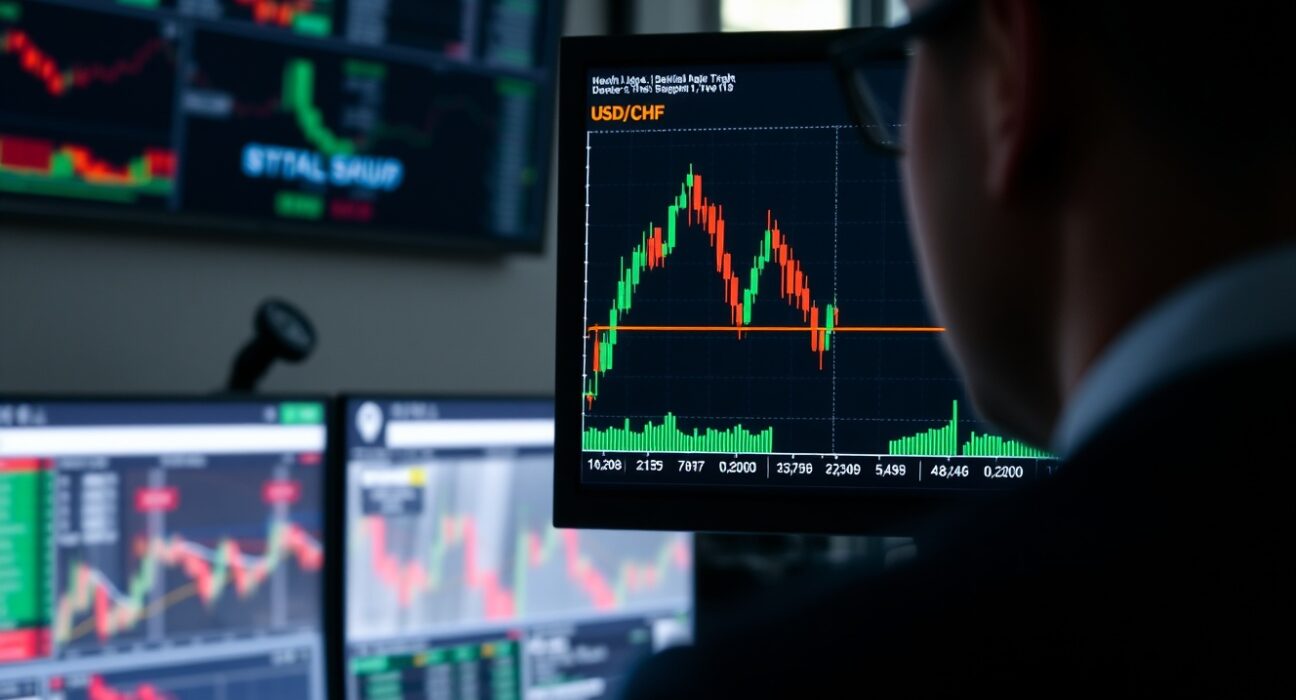
The USD/CHF pair is trading within a bearish flag pattern, a technical formation that often signals a continuation of the prevailing downtrend, with the next downside target emerging near the 0.8200 level. As of the latest session, the pair remains under pressure, reflecting broad US dollar weakness and safe-haven demand for the Swiss franc.
Bearish Flag Formation Signals Further Downside
The bearish flag pattern is characterized by a sharp decline followed by a brief consolidation phase that slopes against the trend. In USD/CHF, this consolidation has taken the form of a rising channel, which is typical of a flag that precedes a resumption of the sell-off. Technical analysts watch for a breakdown below the lower boundary of the flag to confirm the next leg lower.
The measured move of the pattern, derived from the height of the initial flagpole, projects a decline toward the 0.8200 region. This level aligns with prior support zones and round-number psychology, making it a key focus for traders. A sustained break below the flag support could accelerate losses, while a failure to break down might lead to a sideways consolidation or a potential reversal.
Key Levels and Market Context
Immediate resistance is seen at the upper trendline of the flag, currently near 0.8400, followed by the 50-day moving average. On the downside, support is expected at the flag’s lower boundary, around 0.8300, before the 0.8200 target. The Relative Strength Index (RSI) remains in bearish territory, suggesting that momentum is still tilted to the downside, although oversold conditions could prompt short-term bounces.
The broader market environment continues to favor the Swiss franc. The franc often benefits from geopolitical tensions and risk-off sentiment, while the US dollar has been under pressure due to expectations of Federal Reserve rate cuts. Divergence in monetary policy between the Swiss National Bank and the Fed is a critical driver, with the SNB having already signaled a more accommodative stance, yet the franc remains resilient.
Why This Matters for Forex Traders
For forex traders, the bearish flag pattern provides a clear technical roadmap. The setup offers a defined entry point on a breakdown, with a measured target and identifiable stop-loss levels. However, traders should remain cautious, as false breakouts can occur, and fundamental news could override technical signals. The 0.8200 level is not just a technical target but also a psychological barrier that could attract significant buying interest.
Conclusion
USD/CHF is poised for further declines as the bearish flag pattern points to a move toward 0.8200. The pair’s fate hinges on a break below flag support, with the overall trend and momentum favoring the downside. Traders should monitor the 0.8300 intermediate support and be prepared for potential volatility around key economic data releases from both the US and Switzerland.
FAQs
Q1: What is a bearish flag pattern in forex trading?
A bearish flag is a technical chart pattern that suggests a continuation of a downtrend. It forms when a sharp price drop (the flagpole) is followed by a small consolidation channel (the flag) that slopes upward. A breakdown from the flag signals the resumption of the decline.
Q2: How is the 0.8200 target calculated?
The target is derived from the height of the flagpole, measured from the start of the decline to the first low, and then projected downward from the breakout point. This is a common method for estimating the potential move in a flag pattern.
Q3: What could invalidate the bearish flag pattern?
The pattern would be invalidated if the price breaks above the upper boundary of the flag, especially on strong volume. Additionally, unexpected fundamental news, such as a hawkish Fed or a safe-haven shift away from the franc, could cause a reversal.
Disclaimer: The information provided is not trading advice, Bitcoinworld.co.in holds no liability for any investments made based on the information provided on this page. We strongly recommend independent research and/or consultation with a qualified professional before making any investment decisions.
