
On June 30, the BTC/USDT spot pair exhibited notable order book dynamics, as captured by the Cumulative Volume Delta (CVD) and Volume Heatmap indicators. These tools provide traders with a granular view of buying and selling pressure at specific price levels, offering insights beyond simple price action.
Understanding the Volume Heatmap
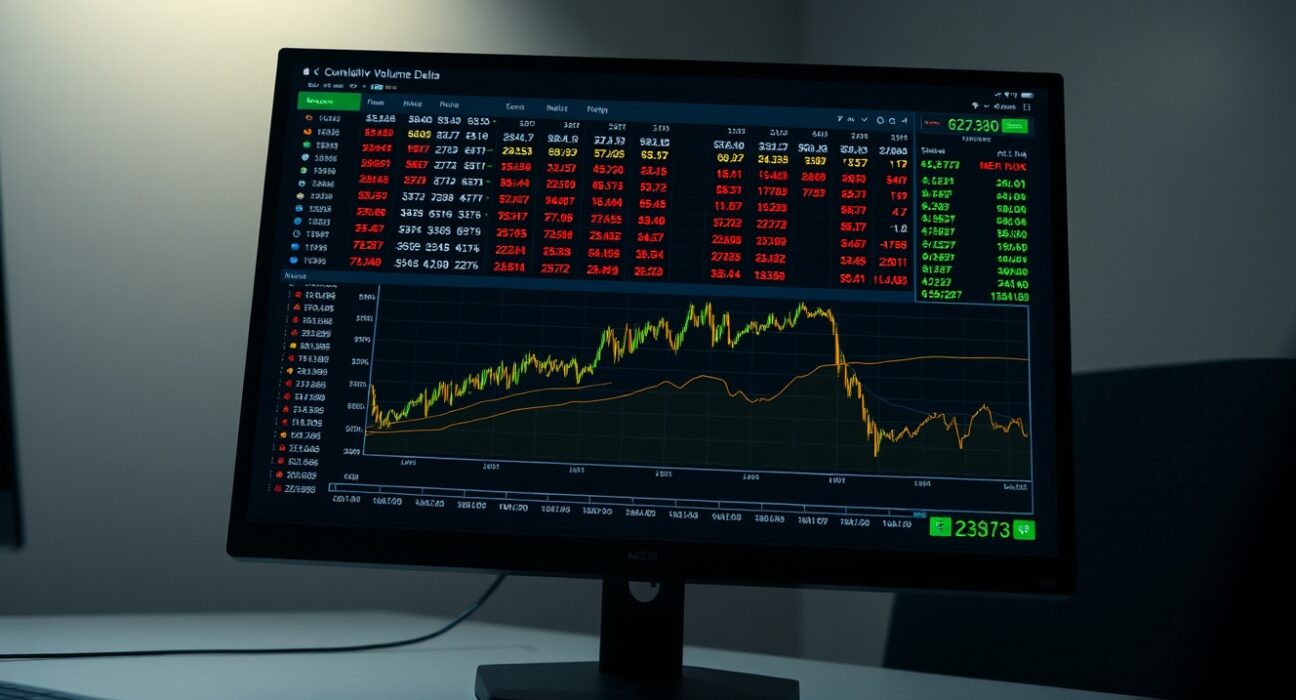
The top section of the chart displays a Volume Heatmap, which visualizes trading activity across different price ranges. Brighter areas on the heatmap indicate price levels where the BTC/USDT pair has lingered or experienced significant movement. These zones often act as potential support or resistance levels, as they represent points of high trader interest and order concentration. For June 30, the heatmap highlighted several key price clusters that may influence short-term market behavior.
Cumulative Volume Delta (CVD) and Trade Size Signals
The lower portion of the chart tracks the Cumulative Volume Delta (CVD), a metric that categorizes buy and sell orders by trade size. This indicator helps distinguish between retail and institutional activity. The yellow line tracks orders between $100 and $1,000, typically associated with smaller retail traders. The brown line monitors large orders between $1 million and $10 million, often linked to institutional or whale activity.
On June 30, the CVD data showed a divergence between these two trade size categories. While retail-sized buying pressure remained relatively steady, the large order segment exhibited a sharp increase in selling pressure during a specific intraday window. This divergence can signal that larger market participants are taking a different directional stance than smaller traders, a pattern worth monitoring for potential trend shifts.
Why This Matters for Traders
For active BTC/USDT traders, combining the Volume Heatmap with CVD analysis provides a more complete picture of market microstructure. The heatmap reveals where price may encounter friction, while the CVD shows who is driving the volume. When large orders dominate the CVD and diverge from price action, it often precedes a reversal or acceleration. On June 30, the divergence between retail and institutional CVD lines suggests that large traders may be positioning for a move, making these levels critical to watch in the coming sessions.
Conclusion
The BTC/USDT spot CVD chart for June 30 offers a data-driven window into order book dynamics. The Volume Heatmap identified key price zones of high activity, while the CVD highlighted a divergence between retail and institutional trade sizes. For traders, this information is not a standalone signal but a valuable layer of context for decision-making. Continued monitoring of these indicators, especially the behavior of large orders, will be important as the market develops.
FAQs
Q1: What does the Cumulative Volume Delta (CVD) show?
The CVD tracks the net difference between buy and sell orders, categorized by trade size. It helps traders see whether buying or selling pressure is dominant and whether that pressure comes from retail or large institutional orders.
Q2: How is the Volume Heatmap different from a standard volume indicator?
A standard volume indicator shows total volume over time. The Volume Heatmap displays volume at specific price levels, highlighting where price has spent the most time or moved significantly. This can reveal potential support and resistance zones.
Q3: Why is the divergence between retail and large orders important?
When large orders (institutional) diverge from retail order flow, it may indicate that sophisticated traders are taking a different directional view. This divergence can precede significant price moves, making it a useful signal for traders who monitor order flow.
Disclaimer: The information provided is not trading advice, Bitcoinworld.co.in holds no liability for any investments made based on the information provided on this page. We strongly recommend independent research and/or consultation with a qualified professional before making any investment decisions.