

2026-05-16
The spot Cumulative Volume Delta (CVD) chart has become a staple tool for Bitcoin traders looking to gauge real-time buying and selling pressure..

The spot Cumulative Volume Delta (CVD) chart has become a staple tool for Bitcoin traders looking to gauge real-time buying and selling pressure..
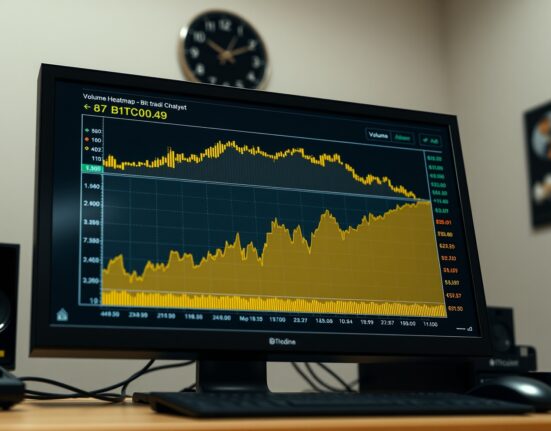
On May 15 at 5:00 p.m. UTC, the BTC spot Cumulative Volume Delta (CVD) chart for the BTC/USDT trading pair revealed notable patterns.

Traders monitoring the Bitcoin spot market have a fresh data point to consider this morning. A detailed analysis of the BTC/USDT order book,.

On May 13, the BTC/USDT spot pair exhibited notable order flow dynamics as tracked by the Spot Cumulative Volume Delta (CVD) chart. This.

On May 12 at 6:00 a.m. UTC, the BTC/USDT spot Cumulative Volume Delta (CVD) chart presented a detailed snapshot of order book dynamics..

As of 00:00 UTC on May 11, the BTC/USDT spot pair order book reveals notable trading patterns through two key visual tools: the.

As of 12:00 a.m. UTC, the BTC/USDT spot pair is exhibiting notable order book activity, as revealed by the Cumulative Volume Delta (CVD).

As of 11:00 a.m. UTC on May 7, the Bitcoin spot Cumulative Volume Delta (CVD) chart for the BTC/USDT pair offers a detailed.

Traders monitoring the BTC/USDT spot pair on May 7, 2025, at 6:00 a.m. UTC are seeing a detailed breakdown of order book dynamics.
On May 7, the BTC/USDT spot Cumulative Volume Delta (CVD) chart is offering traders a granular look at order flow dynamics, revealing which.